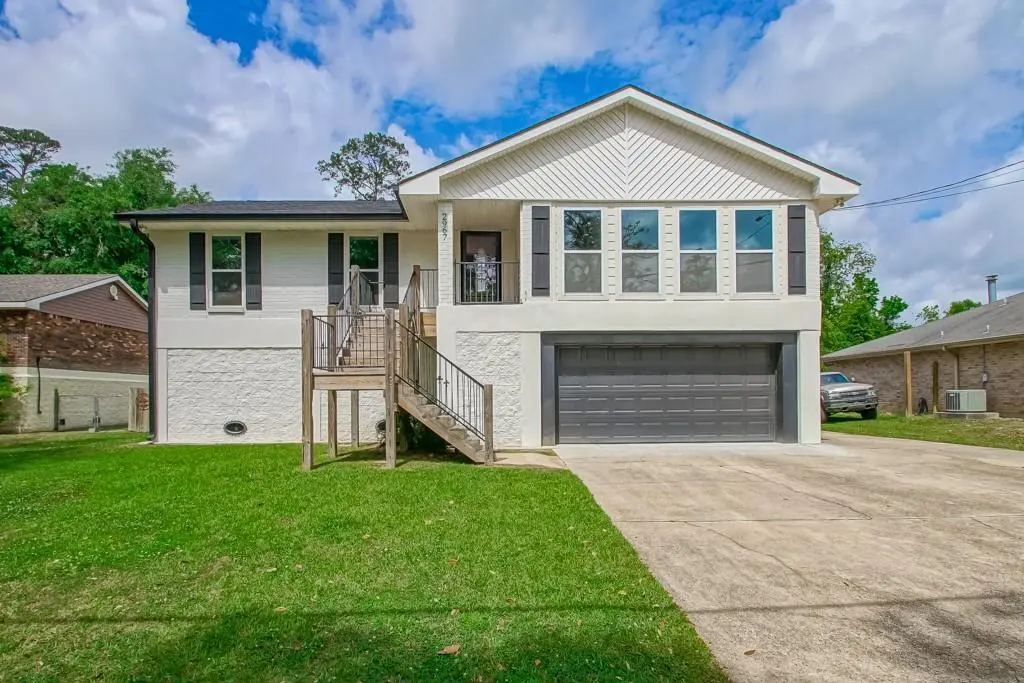
2967 Palm Dr · Slidell, LA
Flood risk No data
- FEMA flood zone
- —
- Chance of flooding over 30 yrs
- —
- Est. flood insurance / yr
- —
Fire risk No data
- Est. fire insurance / yr
- —
Heat risk No data
- Hot days now (above threshold)
- —
- Hot days in 30 yrs
- —
Wind risk No data
- Chance of severe wind over 30 yrs
- —
Air-quality risk No data
- Unhealthy air days now
- —
- Unhealthy air days in 30 yrs
- —
Risk factors via First Street. Map © Google.
Why this score? — see what drove the B- grade
The composite is a weighted blend of 9 inputs, each scored 0–100. Each bar is that input's sub-score; the figure is the points it added to the 100-point composite (weight × sub-score).
- Cash flow +24.2/30.0
- ARV discount +14.6/15.0
- DSCR +7.8/10.0
- 1% rule +6.1/10.0
- Schools +4.3/10.0
- Livability +3.5/5.0
- Rent growth +2.9/5.0
- Condition / age +2.5/5.0
- Appreciation +0.0/10.0
$254,900
🖨 Deal sheet (PDF) 📄 Offer letter ✓ Due diligence
Listing remarks MLS
Completely renovated home featuring 3 beds, 2 baths. Laminate floors throughout. Stone counters, plenty of cabinets, stainless steel appliances in kitchen. Bonus room with stained concrete floors. Primary bath has whirlpool tub, tiled shower and double vanities. Large covered rear porch overlooking inground pool, storage shed and 8' privacy fence. 4+ car garage. See this one today!
Key facts
- Renovated home
- Laminate floors
- Bonus room
Tags
Neighborhood map
What this means for you Summary
Snapshot
- This is a 3-bed/2.0-bath single-family listed at $255k.
Deal economics
- At list price, monthly cash flow is $507 ($6k/yr) — positive.
- The deal already cash-flows at list — no discount required.
- Meets the 1% rule at list price ($3k rent vs $255k).
- Recommended offer: $240k (6.0% below list) — sets the bar for market timing.
- Cap rate 8.7% vs local median 6.0% in Slidell — top-decile yield for the area; either an underpriced asset or a hidden risk that comps aren't pricing in. Stress-test before assuming the spread holds.
Location & tenants
- Location reads 70/100 on livability (#57 in LA) — a middle-class / working-renter tenant base. Strengths: cost of living A+, housing A+, health & safety A+; Watch: amenities F, commute F.
- St. Tammany Parish (suburban): math 43% / reading 55% proficiency, ranked #11 of 98 in LA (top 11%) — families likely to look elsewhere, expect single-tenant / working-renter base with shorter leases.
- Zoned schools: Glynn H. Brock Elementary School (math 32% / reading 42%, grade F, #251 of 646 statewide, top 41%, 320 students, 79% FRL); St. Tammany Junior High School (math 19% / reading 41%, grade F, #114 of 218 statewide, top 53%, 793 students, 68% FRL); Salmen High School (math 15% / reading 27%, grade F, #179 of 265 statewide, top 68%, 1,216 students, 62% FRL) — zoned schools average 70% FRL vs 40% district-wide (30 pts higher); higher-poverty schools than district average — tighter screening recommended.
- Zoned-school proficiency averages 29% at this address vs 49% district-wide (-20 pts) — the specific schools serving this property underperform the St. Tammany Parish average; the district grade overstates school quality for this exact location.
- Market conditions: Rents rising (+1.5%/yr); 490 active listings in the ZIP; 3 comparable units currently listed for rent nearby; rentals at typical pace (median 26d on market — plan ~3-4 weeks tenant-placement turnaround); 1,064 units permitted in St. Tammany Parish in 2024 (0 in 5+ unit buildings).
- At $2,819/mo this rent would consume 46% of the median local household income ($73k/yr) (locally 1331% of renters already pay >50% of income on rent) — very limited rent-growth headroom before tenants either downsize or default.
Forward outlook
- Local home prices are declining (-3.0%/yr); year-one equity from $2k of loan paydown is wiped out by about $8k of value loss. Plan a longer hold.
- St. Tammany County population projected at +27% by 2050 — long-run rental-demand tailwind backs the buy-and-hold thesis.
Negotiation context
- It's been on market 69 days — a 6% lower offer ($240k) is reasonable based on typical stale-listing flexibility.
- 6 sale attempts since 22y ago with the ask held roughly flat each time — persistent listings suggest the price (not the market) is what's stuck; bring a comps-based counter.
- Current owner paid $93k; list at $255k implies a 173% gain — meaningful room to come down on a strong offer.
Questions for the listing agent
- It's been on market 69 days. Have you received any prior offers? Is the seller open to a 6% concession, seller financing, or rate buy-down credit?
- Built in 1976 — when were the roof, HVAC, electrical panel, plumbing, and water heater last replaced?
- Why hasn't it sold? Are there any deal-killer items the seller is aware of (foundation, flood, title, zoning, code violations)?
- Is there a deadline driving the sale (1031 exchange, divorce, estate, relocation)? That informs how much negotiation room exists.
- Schools are B-rated — typically a magnet for longer-tenancy family renters. What's the average tenant stay here, and is there a school-zone premium baked into asking?
- What's the average days-on-market for RENTAL listings here right now (not sales)? A rising rental-DOM trend means longer vacancies and softer asking-rent achievability than the comps imply.
- What's the recent tenant-quality profile in this submarket — average credit score on applications, eviction rate, late-payment / NSF rate, and stable-employment percentage? A property-management company in the area should have these aggregated.
- How much new for-sale + rental construction is in the pipeline within 1–3 miles? Heavy new supply typically softens prices + rents 12–24 months out; constrained supply supports both.
Investment metrics
- 1% rule
- 1.11% ✓
- Cap rate
- 8.68%
- Cash-on-cash
- 8.52%
- DSCR
- 1.38
- GRM
- 7.5
CMA / ARV
- ARV (median comp)
- $302,386
- List price
- $254,900
- Delta
- -15.70%
- Verdict
- UNDERPRICED
- Comps
- 20 within 1.0 mi
Show comp detail 7 sales within ~0.75 mi
| Address | Dist | Beds/Ba | Sqft | Sold | Price | $/sf | Match |
|---|---|---|---|---|---|---|---|
| 3004 S Palm Dr | 0.21mi | 4/3.0 (+1) | 2,378 (+3%) | 0mo | $256,000 | $108 | 76 |
| 311 Oleander Dr | 0.18mi | 4/3.0 (+1) | 2,144 (-7%) | 8mo | $141,800 | $66 | 64 |
| 57316 Talen Ln | 0.21mi | 4/3.5 (+1) | 2,407 (+4%) | 22mo | $347,000 | $144 | 54 |
| 2239 1st St | 0.71mi | 3/2.0 | 2,010 (-13%) | 1mo | $292,000 | $145 | 44 |
| 3618 Meadowdale | 0.62mi | 4/2.0 (+1) | 2,026 (-12%) | 5mo | $180,000 | $89 | 41 |
| 3069 S Palm Dr | 0.66mi | 3/2.0 | 2,172 (-6%) | 24mo | $125,000 | $58 | 40 |
| 3103 Bayouview Pl | 0.74mi | 4/2.5 (+1) | 2,083 (-10%) | 20mo | $125,000 | $60 | 26 |
Match score weights: distance 35% · size 25% · config 20% · recency 20%. Top-matched comps best support the ARV.
Projected returns pro-forma
-3.0% appreciation · 1.47% rent growth · sell at horizon
- IRR
- -5.1%
- Equity multiple
- 0.81×
- Total profit
- $-13,301
- Equity at exit
- $38,006
- IRR
- 2.7%
- Equity multiple
- 1.18×
- Total profit
- $13,020
- Equity at exit
- $22,039
Cash invested: $71,372 (down + closing). Projections, not guarantees.
Landlord ↔ Tenant lean methodology
- Overall (STATE)
- 90 Strongly Landlord-Friendly
- State Louisiana
- 90 Strongly Landlord-Friendly · R+12
- County
- — inherits STATE
- City
- — inherits STATE
ZIP-level market 70458
- Rents YoY
- 1.5%
- Active inventory
- 490
- Price-to-rent
- 7.5×
Monthly cashflow live
- Estimated rent
- $2,819 medium interval (Pro) →
- Mortgage (P&I)
- −$1,337
- Tax from tax record
- −$277 /mo · $3,329/yr
- Insurance
- −$106
- HOA
- −$0
- Lot rent
- −$0
- Vacancy / Maint / Mgmt
- −$592
- Net cashflow
- $507
Break-even live
Sensitivity live
| Price | -10% $651 | -5% $579 | +0% $507 | +5% $434 | +10% $362 |
|---|---|---|---|---|---|
| Rent | -10% $284 | -5% $395 | +0% $507 | +5% $618 | +10% $729 |
| Rate | -1.0pp $635 | -0.5pp $571 | base $507 | +0.5pp $440 | +1.0pp $373 |
UW: 25.0% down · 7.5% · 30yr · 1.5% tax · 5.0% vac · 8.0% maint · 8.0% mgmt
Financing live
Cash to close
- Down payment
- $63,725
- Closing costs
- $7,647
- Reserves months
- —
- Total cash needed
- —
Loan-product check · same deal, 3 products live
Conventional
25% down · 7.5% · 30yr
- Down + closing
- —
- Monthly P&I
- —
- Monthly cashflow
- —
- DSCR
- —
- Eligible?
- —
Personal DTI + credit; lowest rate.
DSCR
20% down · 8.5% · 30yr
- Down + closing
- —
- Monthly P&I
- —
- Monthly cashflow
- —
- DSCR
- —
- Eligible?
- —
No personal income docs; deal must DSCR.
Hard money
10% down · 12.0% · 12mo
- Down + closing
- —
- Monthly P&I
- —
- Monthly cashflow
- —
- DSCR
- —
- Eligible?
- —
Short-term bridge; refi at stabilization.
Rent comps 3 comps
| Address | Beds | Baths | Sqft | Rent | $/sqft | DOM | Units | Dist |
|---|---|---|---|---|---|---|---|---|
| 3106 Little Pl Slidell, LA | 3.0 | 3.0 | 3000 | $4,900 | $1.63 | 5d | 1 | 0.72mi |
| 3839 Oxford St Slidell, LA | 3.0 | 2.0 | 1660 | $1,700 | $1.02 | 46d | 1 | 1.13mi |
| 1111 Saint Scholastica St Slidell, LA | 3.0 | 2.0 | 2037 | $2,000 | $0.98 | 26d | 1 | 1.38mi |
Listing history 24 events
-
2026-06-22days on market $254,900 Active 69 DOM
-
2026-06-21days on market $254,900 Active 68 DOM
-
2026-06-18days on market $254,900 Active 65 DOM
-
2026-06-17days on market $254,900 Active 64 DOM
-
2026-06-16days on market $254,900 Active 63 DOM
-
2026-06-15days on market $254,900 Active 62 DOM
-
2026-06-13days on market $254,900 Active 60 DOM
-
2026-06-10days on market $254,900 Active 57 DOM
-
2026-06-09days on market $254,900 Active 56 DOM
-
2026-06-08days on market $254,900 Active 55 DOM
-
2026-06-07days on market $254,900 Active 54 DOM
-
2026-06-03days on market $254,900 Active 50 DOM
-
2026-06-02pricedays on market $254,900 Active 49 DOM
-
2026-06-01days on market $259,900 Active 48 DOM
-
2026-05-31days on market $259,900 Active 47 DOM
-
2026-04-14$259,900 Active 384-char remark
Show marketing remark (384 chars)
Completely renovated home featuring 3 beds, 2 baths. Laminate floors throughout. Stone counters, plenty of cabinets, stainless steel appliances in kitchen. Bonus room with stained concrete floors. Primary bath has whirlpool tub, tiled shower and double vanities. Large covered rear porch overlooking inground pool, storage shed and 8' privacy fence. 4+ car garage. See this one today!
-
2023-08-15soldstatus $93,274
-
2013-08-05$165,000
-
2013-08-05$165,000
-
2004-09-13soldstatus $138,500
-
2004-09-10soldstatus $138,500
-
2004-05-03$142,900
-
2004-05-03$142,900
ⓘ Source: listings_history table (triggers on properties + properties_extension) + one-shot
backfill from property_details.listing_events for pre-trigger history.
Tax reassessment forecast LA · Resets to sale price
- Current annual tax
- $3,329 · $277/mo
- Projected year-2 tax
- $3,329 · $277/mo
- Expected delta
- $0/yr ($0/mo · 0.0%)
ⓘ Screening estimate from a state-policy table — verify with the county assessor before closing.
Nearby sold comps map
Loading sold comps map…
Walkable amenities ~0.75 mi
Loading nearby amenities…
Taxation est. · year 1
- Rental income
- $33,825
- − Mortgage interest
- −$14,278
- − Property taxes
- −$3,329
- − Insurance
- −$1,274
- − Repairs & maintenance
- −$2,706
- − Management
- −$2,706
- − Depreciation
- −$7,415
- Taxable income
- $2,117
- Est. tax owed @ 24.0%
- −$508
- After-tax cash flow
- $5,570/yr
For passive investors: Depreciation is non-cash, so a rental often shows a tax loss while cash-flowing — sheltering income. Rental losses are passive: they offset passive income freely, and up to $25,000/yr can offset ordinary (W-2) income if you actively participate and your MAGI is under $100k (phasing out to $0 by $150k); unused losses carry forward. On sale, claimed depreciation is recaptured at up to 25%, and gains may owe capital-gains tax (a 1031 exchange can defer both). Figures are a year-1 estimate at your 24.0% rate — not tax advice; consult a CPA.
Schools (NCES district)
- District
- St. Tammany Parish
- NCES district ID
- 2201650
- Math proficiency
- 43% ▼ -32.00%
- Reading proficiency
- 55% ▼ -26.00%
- Median HH income
- $61,752
- Composite
- 43.04/100
- National rank
- #3098
- State rank
- #11 of 98 in LA
Livability — Slidell
- Score
- 70/100
- State rank
- #57
- US rank
- #7673
Category grades
Schools grade is shown separately in the Schools card above.
Census & demographics
- Census place
- Slidell, LA
- County
- Saint Tammany Parish · 228,296 people
- City population
- 95,511
- Metro
- New Orleans-Metairie, LA
- Population (ZIP)
- 39,034
- Household income
- $72,843
- Rent vs Own
- Severe rent burden
- 1331.0
Population outlook (St. Tammany County) Hauer SSP2
- Today (2025)
- 286,725 people
- By 2030
- 304,175 · +6.1%
- By 2040
- 336,203 · +17.3%
- By 2050
- 364,590 · +27.2%
- By 2075
- 433,362 · +51.1%
- By 2100
- 470,333 · +64.0%
Race, ethnicity, and origin ACS 2023
- Neighborhood character
- Predominantly White (66%)
- Race & ethnicity
- White 66% Black 17% Two or more races 10% Hispanic / Latino 9% Native American 2% Asian 1%
- Hispanic origin (detail)
- Mexican 3% Puerto Rican 1%
- Common ancestry
- Lithuanian 15% Slovak 2% Romanian 1%
- Foreign-born
- 3% · Canada, Vietnam
- Languages at home
- 93% English-only · Spanish 5% Vietnamese 1%
Political lean MEDSL · St. Tammany
- 2024 margin
- Solid R (+43.8) · D 27.3% · R 71.1% · Other 1.6%
- 2008→2024 swing
- +9.6pp toward D · 2008: -53.4pp · 2024: -43.8pp
- All cycles
- 2024: R+43.8 2020: R+44.2 2016: R+50.8 2012: R+52.2 2008: R+53.4
Not yet ingested
- Civics
- —
Market trends
- HPI YoY
- ▼ -173.60%
- Current HPI
- 147.4749
- Rent YoY
- ▲ 1.47%
- Metro
- New Orleans-Metairie, LA
- State GDP YoY
- ▲ 3.29%
- F500 in state
- 10
Industry mix (Fortune 500 HQ in LA)
| Industry | F500 HQs | Revenue |
|---|---|---|
| Telecommunications | 2 | $23B |
|
||
| Utilities | 1 | $12B |
|
||
| Wholesale / Distribution | 1 | $5B |
|
||
| Advertising | 1 | $2B |
|
||
Price history
+81.9% since first listed9 events — show timeline
- 2026-04-14 Listed $259,900 AcadianaMLS
- 2026-04-14 Listed $259,900 GSREIN
- 2023-08-15 Sold (Public Records) $93,274 Public Records
- 2013-08-05 Listed $165,000 GSREIN
- 2013-08-05 Listed $165,000 AcadianaMLS
- 2004-09-13 Sold (Public Records) $138,500 Public Records
- 2004-09-10 Sold (MLS) $138,500 GSREIN
- 2004-05-03 Listed $142,900 GSREIN
- 2004-05-03 Listed $142,900 AcadianaMLS
Property tax history
+2.0%/yrLatest (2025): $3,329 · +3.7% YoY. Source: county tax records.
Cash-flow waterfall
monthlySold comps — $/sqft
last 12 mo · ≤1 miLoading sold comps…