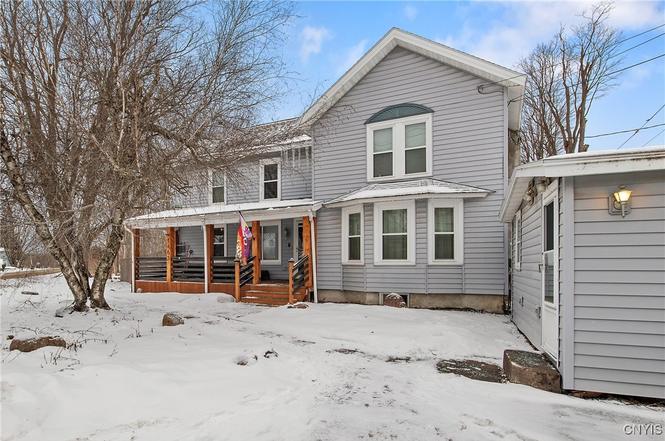
1465 County Route 12
Sand Ridge, NY 13036
$259,900C-
4 bd · 1.5 ba ·
1,984 sqft ·
Built 1940
· SingleFamily
· Pending
· 70 DOM
Cashflow @ list (25.0% down · 7.5%)
Estimated rent
$2,107/mo
Mortgage (P&I)
−$1,363
Tax + insurance
−$509
HOA
−$0
Vac / Maint / Mgmt
−$443
Net cashflow
$-207/mo
Annual
$-2,484/yr
Cap rate
5.34%
Cash-on-cash
-3.41%
DSCR
0.85
1% rule
0.81%
Cash to close
$72,772
Investor read
- This is a 4-bed/1.5-bath single-family listed at $260k.
- At list price, monthly cash flow is $-207 ($-2k/yr) — negative.
- To cash-flow at today's rent, offer at most $223k (14.1% below list).
- To meet the 1% rule (rent ≥ 1% of price), the offer needs to be $211k (18.9% below list).
- It's been on market 70 days — a 6% lower offer ($244k) is reasonable based on typical stale-listing flexibility.
- Recommended offer: $211k (18.9% below list) — sets the bar for 1% rule.
- In year one you build about $28k of equity ($2k loan paydown + $26k appreciation (10.0% local appreciation)).
- Location reads 61/100 on livability (#926 in NY) — a middle-class / working-renter tenant base. Strengths: housing A+, cost of living A, crime A-; Watch: employment D+, amenities F, commute F.
- Central Square Central School District (suburban): math 40% / reading 40% proficiency, ranked #507 of 590 in NY (top 86%) — families likely to look elsewhere, expect single-tenant / working-renter base with shorter leases.
- Zoned schools: Millard Hawk Elementary School (math 22% / reading 32%, grade F, #1,786 of 2,108 statewide, top 86%, 477 students, 52% FRL); Central Square Middle School (math 19% / reading 35%, grade F, #587 of 729 statewide, top 81%, 833 students, 45% FRL); Paul V Moore High School (math 91% / reading 75%, grade A, #440 of 1,100 statewide, top 40%, 1,101 students, 44% FRL).
- Watch-outs: built in 1940 — expect roof / HVAC / electrical / plumbing capex.
- Market conditions: 36 active listings in the ZIP; 172 units permitted in Oswego County in 2024 (27 in 5+ unit buildings).
- Oswego County population projected at -23% by 2050 — secular population decline; favor cash flow + early exit over multi-decade hold.
- 5 sale attempts since 7y ago with the ask held roughly flat each time — persistent listings suggest the price (not the market) is what's stuck; bring a comps-based counter.
- Current owner paid $159k; list at $260k implies a 63% gain — meaningful room to come down on a strong offer.
- By year 2, paydown + projected appreciation supports a ~$45k cash-out refi (75% LTV) — recoverable capital for the next deal without selling this one.
- Cap rate 5.3% vs local median 3.4% in Sand Ridge — top-decile yield for the area; either an underpriced asset or a hidden risk that comps aren't pricing in. Stress-test before assuming the spread holds.
Questions for listing agent
- What do current leases actually rent for vs. the listed asking? Can we see a recent rent roll and the last 12 months of T-12 income?
- It's been on market 70 days. Have you received any prior offers? Is the seller open to a 19% concession, seller financing, or rate buy-down credit?
- Built in 1940 — when were the roof, HVAC, electrical panel, plumbing, and water heater last replaced?
- Why hasn't it sold? Are there any deal-killer items the seller is aware of (foundation, flood, title, zoning, code violations)?
- Is there a deadline driving the sale (1031 exchange, divorce, estate, relocation)? That informs how much negotiation room exists.
- Schools are F-rated, which usually means shorter tenancies and higher turnover. Who's the typical renter profile here, and what's been the actual vacancy rate?
- What's the average days-on-market for RENTAL listings here right now (not sales)? A rising rental-DOM trend means longer vacancies and softer asking-rent achievability than the comps imply.
- What's the recent tenant-quality profile in this submarket — average credit score on applications, eviction rate, late-payment / NSF rate, and stable-employment percentage? A property-management company in the area should have these aggregated.
CashFlowRE · CFR-3N3HJD1YYJ3KW2
· Data 4 weeks ago
cashflowre.app · 2026-05-29