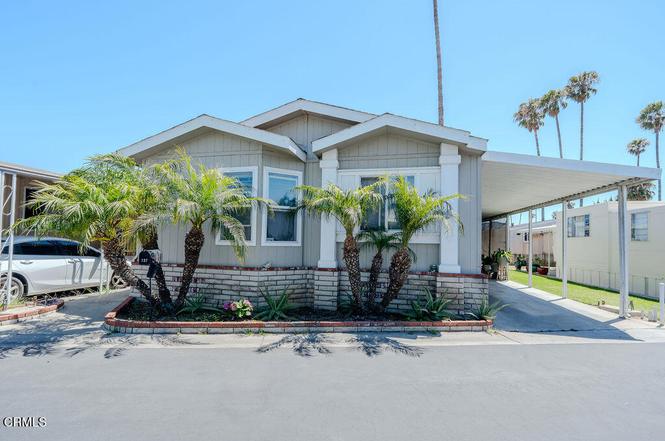
205 E Driffill Blvd #137
Oxnard, CA 93030
$310,000D+
3 bd · 2.0 ba ·
1,200 sqft ·
Built 2006
· Manufactured
· Active
· 1 DOM
Cashflow @ list (25.0% down · 7.5%)
Estimated rent
$3,151/mo
Mortgage (P&I)
−$1,626
Tax + insurance
−$517
HOA
−$0
Vac / Maint / Mgmt
−$662
Net cashflow
$347/mo
Annual
$4,163/yr
Cap rate
7.64%
Cash-on-cash
4.80%
DSCR
1.21
1% rule
1.02%
Cash to close
$86,800
Investor read
- This is a 3-bed/2.0-bath manufactured listed at $310k.
- At list price, monthly cash flow is $347 ($4k/yr) — positive.
- The deal already cash-flows at list — no discount required.
- Meets the 1% rule at list price ($3k rent vs $310k).
- Only 1 days on market — expect competitive offers; lowballing is unlikely to land.
- Local home prices are declining (-3.0%/yr); year-one equity from $2k of loan paydown is wiped out by about $9k of value loss. Plan a longer hold.
- Location reads 54/100 on livability (#905 in CA) — a working-class tenant base; expect higher turnover. Strengths: employment A-, health & safety A-, housing B; Watch: schools F, crime F, amenities D-.
- Oxnard Union High (urban): math 28% / reading 51% proficiency, ranked #220 of 517 in CA (top 43%) — families likely to look elsewhere, expect single-tenant / working-renter base with shorter leases.
- Market conditions: Rents rising (+1.2%/yr); 29 active listings in the ZIP; 15 comparable units currently listed for rent nearby; rentals leasing fast (median 2d on market — plan ~1-2 weeks tenant-placement turnaround); solid renter incomes; 1,759 units permitted in Ventura County in 2024 (1,196 in 5+ unit buildings).
- Ventura County population projected at +4% by 2050 — modest demand growth; plan on rents tracking national, not racing it.
- Cap rate 7.6% vs local median 2.5% in Oxnard — top-decile yield for the area; either an underpriced asset or a hidden risk that comps aren't pricing in. Stress-test before assuming the spread holds.
- This rent runs 41% of the median local income ($93k/yr) — at the standard rent-burdened threshold; future hikes will face affordability resistance.
Questions for listing agent
- Is there a deadline driving the sale (1031 exchange, divorce, estate, relocation)? That informs how much negotiation room exists.
- Schools are F-rated, which usually means shorter tenancies and higher turnover. Who's the typical renter profile here, and what's been the actual vacancy rate?
- Crime grade is F in this area — have there been break-ins, vandalism, or insurance claims at this property in the last 3 years? What carrier currently insures it and at what premium?
- The area grade is low — what's the realistic commute time and amenity access for the typical tenant pool here? Any planned neighborhood developments (good or bad) we should know about?
- What's the average days-on-market for RENTAL listings here right now (not sales)? A rising rental-DOM trend means longer vacancies and softer asking-rent achievability than the comps imply.
- What's the recent tenant-quality profile in this submarket — average credit score on applications, eviction rate, late-payment / NSF rate, and stable-employment percentage? A property-management company in the area should have these aggregated.
- How much new for-sale + rental construction is in the pipeline within 1–3 miles? Heavy new supply typically softens prices + rents 12–24 months out; constrained supply supports both.
CashFlowRE · CFR-3NGATE0QH2PY1M
· Data 1 day ago
cashflowre.app · 2026-05-29