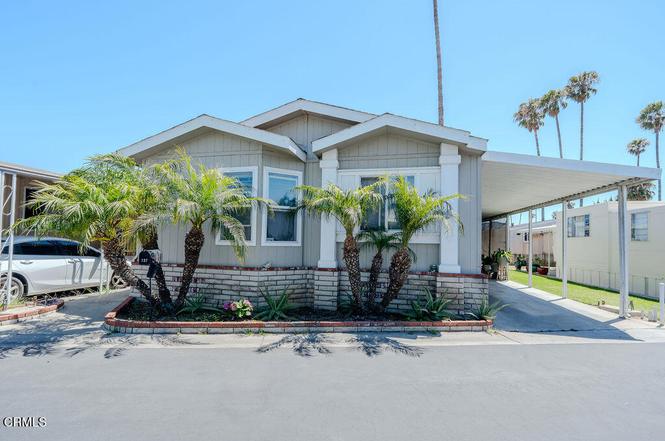
205 E Driffill Blvd #137 · Oxnard, CA
Flood risk 1/10 · Minimal
- FEMA flood zone
- X (unshaded)
- Chance of flooding over 30 yrs
- 0.0%
- Est. flood insurance / yr
- $507 – $1,088
Fire risk 1/10 · Minimal
- Est. fire insurance / yr
- $659 – $1,223
Heat risk 3/10 · Minor
- Hot days now (above 86°F)
- 7 days/yr
- Hot days in 30 yrs
- 16 days/yr
Wind risk 1/10 · Minimal
- Chance of severe wind over 30 yrs
- —
Air-quality risk 4/10 · Minor
- Unhealthy air days now
- 4 days/yr
- Unhealthy air days in 30 yrs
- 5 days/yr
Risk factors via First Street. Map © Google.
Why this score? — see what drove the D+ grade
The composite is a weighted blend of 9 inputs, each scored 0–100. Each bar is that input's sub-score; the figure is the points it added to the 100-point composite (weight × sub-score).
- Cash flow +19.4/30.0
- ARV discount +7.5/15.0
- DSCR +6.1/10.0
- 1% rule +5.2/10.0
- Schools +3.6/10.0
- Rent growth +2.8/5.0
- Livability +2.7/5.0
- Condition / age +2.5/5.0
- Appreciation +0.0/10.0
$310,000
🖨 Deal sheet 📄 Offer letter ✓ Due diligence
Listing remarks
Welcome home to The Daffodil on Driffill! This lovely 3 bedroom & 2 bathroom home has been well taken care of and resides in one of the lowest cost mobile parks in Ventura County. With some utilities included in the space rent, community amenities, and a central location near downtown Oxnard - you'd be hard pressed to find a better value. Moving into the home, you're greeted by an open living room with a vaulted ceilings and a unique clerestory window that creates an airy feeling while drawing in natural light to showcase its beautiful wood laminate flooring. Across the room is the dining room which leads you directly into a galley kitchen where there is a wealth of cabinet and counte
Key facts
- Side entrance
- Open living room
- Galley kitchen
Tags
Property features AI
Finance
- Other: Body type: double; Number of pads: 1; Pets: call
- Financial info: Land lease (park) $1,200 monthly; Rent includes trash, water, sewer (see remarks)
- HOA & community: Community features: curbs, street lighting, suburban; Park name: Royal Palms Mobile Home Park; Manager approval required
Exterior
- Parking: Two parking spaces; Carport (attached); Tandem covered parking; Driveway (concrete); Gated entry; Guest parking; Built-in storage
- Security: Gated community; Smoke detector; Carbon monoxide detector; Resident manager
- Utilities: District/public water; Public sewer; Standard electric; Natural gas connected; Sewer connected; Electricity connected; Water connected; Cable connected
- Home design: Mobile home (model: Charleston IV); Mobile home remains on site; One level; Access via city streets and private road; Subdivision: Royal Palm MHP
- Construction: Wood construction with vertical siding; Drywall interior walls; Composition/shingle roof; Pier jacks foundation; Skirt: wood, brick, concrete, siding
- Exterior features: Concrete open patio/slab; Patio; Rain gutters; Shed (1); Garden and backyard; Greenbelt; Sprinklers in rear; Community in-ground pool
Interior
- Kitchen: Gas range and gas oven; Range/stove hood; Microwave; Refrigerator; Dishwasher; Water heater unit; Formica and laminate counters; Galley kitchen
- Bedrooms: Primary bedroom; All bedrooms on main floor; Main floor bedroom
- Flooring: Laminate flooring
- Bathrooms: Two full bathrooms; Shower in tub; Walk-in shower; Bathtub
- Heating & cooling: Central cooling; Forced air heating; Central furnace
- Interior features: High ceilings (9 feet+); Ceiling fan; Panel doors; Double pane windows; Skylights; Blinds; Laminate counters; Formica counters
- Laundry & utility: Washer hookup; Gas dryer hookup; Laundry located in closet; Washer/dryer units excluded (seller may remove); Washer/dryer location: see remarks
Neighborhood map
What this means for you Summary
Snapshot
- This is a 3-bed/2.0-bath manufactured listed at $310k.
Deal economics
- At list price, monthly cash flow is $347 ($4k/yr) — positive.
- The deal already cash-flows at list — no discount required.
- Meets the 1% rule at list price ($3k rent vs $310k).
- Cap rate 7.6% vs local median 2.5% in Oxnard — top-decile yield for the area; either an underpriced asset or a hidden risk that comps aren't pricing in. Stress-test before assuming the spread holds.
Location & tenants
- Location reads 54/100 on livability (#905 in CA) — a working-class tenant base; expect higher turnover. Strengths: employment A-, health & safety A-, housing B; Watch: schools F, crime F, amenities D-.
- Oxnard Union High (urban): math 28% / reading 51% proficiency, ranked #220 of 517 in CA (top 43%) — families likely to look elsewhere, expect single-tenant / working-renter base with shorter leases.
- Market conditions: Rents rising (+1.2%/yr); 29 active listings in the ZIP; 15 comparable units currently listed for rent nearby; rentals leasing fast (median 2d on market — plan ~1-2 weeks tenant-placement turnaround); solid renter incomes; 1,759 units permitted in Ventura County in 2024 (1,196 in 5+ unit buildings).
- This rent runs 41% of the median local income ($93k/yr) — at the standard rent-burdened threshold; future hikes will face affordability resistance.
Forward outlook
- Local home prices are declining (-3.0%/yr); year-one equity from $2k of loan paydown is wiped out by about $9k of value loss. Plan a longer hold.
- Ventura County population projected at +4% by 2050 — modest demand growth; plan on rents tracking national, not racing it.
Negotiation context
- Only 1 days on market — expect competitive offers; lowballing is unlikely to land.
Questions for the listing agent
- Is there a deadline driving the sale (1031 exchange, divorce, estate, relocation)? That informs how much negotiation room exists.
- Schools are F-rated, which usually means shorter tenancies and higher turnover. Who's the typical renter profile here, and what's been the actual vacancy rate?
- Crime grade is F in this area — have there been break-ins, vandalism, or insurance claims at this property in the last 3 years? What carrier currently insures it and at what premium?
- The area grade is low — what's the realistic commute time and amenity access for the typical tenant pool here? Any planned neighborhood developments (good or bad) we should know about?
- What's the average days-on-market for RENTAL listings here right now (not sales)? A rising rental-DOM trend means longer vacancies and softer asking-rent achievability than the comps imply.
- What's the recent tenant-quality profile in this submarket — average credit score on applications, eviction rate, late-payment / NSF rate, and stable-employment percentage? A property-management company in the area should have these aggregated.
- How much new for-sale + rental construction is in the pipeline within 1–3 miles? Heavy new supply typically softens prices + rents 12–24 months out; constrained supply supports both.
Investment metrics
- 1% rule
- 1.02% ✓
- Cap rate
- 7.64%
- Cash-on-cash
- 4.80%
- DSCR
- 1.21
- GRM
- 8.2
CMA / ARV
No comps found within radius.
Projected returns pro-forma
-3.0% appreciation · 1.23% rent growth · sell at horizon
- IRR
- -10.8%
- Equity multiple
- 0.61×
- Total profit
- $-33,605
- Equity at exit
- $46,222
- IRR
- -4.3%
- Equity multiple
- 0.74×
- Total profit
- $-22,456
- Equity at exit
- $26,803
Cash invested: $86,800 (down + closing). Projections, not guarantees.
Landlord ↔ Tenant lean methodology
- Overall (STATE)
- 18 Strongly Tenant-Friendly
- State California
- 18 Strongly Tenant-Friendly · D+13
- County
- — inherits STATE
- City
- — inherits STATE
ZIP-level market 93030
- Rents YoY
- 1.2%
- Active inventory
- 29
- Price-to-rent
- 8.2×
Monthly cashflow live
- Estimated rent
- $3,151 high interval (Pro) →
- Mortgage (P&I)
- −$1,626
- Tax est. 1.5%
- −$388 /mo · $4,650/yr
- Insurance
- −$129
- HOA
- −$0
- Vacancy / Maint / Mgmt
- −$662
- Net cashflow
- $347
Break-even live
UW: 25.0% down · 7.5% · 30yr · 1.5% tax · 5.0% vac · 8.0% maint · 8.0% mgmt
Financing live
Cash to close
- Down payment
- $77,500
- Closing costs
- $9,300
- Reserves months
- —
- Total cash needed
- —
Loan-product check · same deal, 3 products live
Conventional
25% down · 7.5% · 30yr
- Down + closing
- —
- Monthly P&I
- —
- Monthly cashflow
- —
- DSCR
- —
- Eligible?
- —
Personal DTI + credit; lowest rate.
DSCR
20% down · 8.5% · 30yr
- Down + closing
- —
- Monthly P&I
- —
- Monthly cashflow
- —
- DSCR
- —
- Eligible?
- —
No personal income docs; deal must DSCR.
Hard money
10% down · 12.0% · 12mo
- Down + closing
- —
- Monthly P&I
- —
- Monthly cashflow
- —
- DSCR
- —
- Eligible?
- —
Short-term bridge; refi at stabilization.
Rent comps 15 comps
| Address | Beds | Baths | Sqft | Rent | $/sqft | DOM | Units | Dist |
|---|---|---|---|---|---|---|---|---|
| 875 S B St Oxnard, CA | 2.0 | 2.5 | 1077 | $2,875 | $2.67 | 2d | 1 | 0.33mi |
| 235 Wolff St Unit B Oxnard, CA | 2.0 | 1.0 | 1000 | $2,595 | $2.60 | 2d | 1 | 0.44mi |
| 227 Wolff St Unit 229 Oxnard, CA | 2.0 | 1.0 | 1000 | $2,645 | $2.65 | 2d | 1 | 0.45mi |
| 505 Wolff St Oxnard, CA | 4.0 | 2.0 | 1200 | $3,800 | $3.17 | 19d | 1 | 0.57mi |
| 105 S Roosevelt Ave Oxnard, CA | 3.0 | 2.0 | 1370 | $4,500 | $3.28 | 14d | 1 | 0.61mi |
| 712 S G St Unit E Oxnard, CA | 2.0 | 1.0 | 856 | $2,149 | $2.51 | 2d | 1 | 0.62mi |
| 530 S I St Apt 2 Oxnard, CA | 2.0 | 1.5 | 800 | $2,400 | $3.00 | 2d | 1 | 0.87mi |
| 1212 Jamaica Ln Oxnard, CA | 2.0 | 2.5 | 1360 | $3,000 | $2.21 | 10d | 1 | 0.99mi |
| 549 Carty Dr Oxnard, CA | 2.0 | 1.0 | 750 | $2,895 | $3.86 | 2d | 1 | 1.05mi |
| 1311 Oyster Pl Oxnard, CA | 2.0 | 2.5 | 1222 | $3,295 | $2.70 | 14d | 1 | 1.08mi |
| 1150 W 1st St Oxnard, CA | 3.0 | 2.0 | 1201 | $4,100 | $3.41 | 10d | 1 | 1.09mi |
| 751 W Channel Islands Blvd Unit 6 Oxnard, CA | 2.0 | 2.0 | 750 | $2,495 | $3.33 | 16d | 1 | 1.40mi |
| 751 W Channel Islands Blvd Unit 1 Oxnard, CA | 2.0 | 2.0 | 750 | $2,395 | $3.19 | 2d | 1 | 1.40mi |
| 801 N M St Unit 801 Oxnard, CA | 2.0 | 1.5 | 1223 | $2,900 | $2.37 | 16d | 1 | 1.48mi |
| 801 N M St Oxnard, CA | 2.0 | 1.5 | 1223 | $2,850 | $2.33 | 2d | 1 | 1.48mi |
Listing history 2 events
-
2026-06-19remarks 695-char remark
-
2026-06-19$310,000 Active 1 DOM
ⓘ Source: listings_history table (triggers on properties + properties_extension) + one-shot
backfill from property_details.listing_events for pre-trigger history.
Climate risk First Street
- Flood 1/10 Low FEMA zone X (unshaded) · 0% chance over 30 yrs
- Wildfire 1/10 Low
- Heat 3/10 Moderate 7 d/yr ≥86°F today · 16 d/yr by 30 yrs out
- Wind 1/10 Low
- Air quality 4/10 Moderate 4 unhealthy d/yr today · 5 by 30 yrs out
Nearby sold comps map
Loading sold comps map…
Walkable amenities ~0.75 mi
Loading nearby amenities…
Taxation est. · year 1
- Rental income
- $37,812
- − Mortgage interest
- −$17,365
- − Property taxes
- −$4,650
- − Insurance
- −$1,550
- − Repairs & maintenance
- −$3,025
- − Management
- −$3,025
- − Depreciation
- −$9,018
- Taxable loss
- −$821
- Est. tax savings @ 24.0%
- +$197
- After-tax cash flow
- $4,360/yr
For passive investors: Depreciation is non-cash, so a rental often shows a tax loss while cash-flowing — sheltering income. Rental losses are passive: they offset passive income freely, and up to $25,000/yr can offset ordinary (W-2) income if you actively participate and your MAGI is under $100k (phasing out to $0 by $150k); unused losses carry forward. On sale, claimed depreciation is recaptured at up to 25%, and gains may owe capital-gains tax (a 1031 exchange can defer both). Figures are a year-1 estimate at your 24.0% rate — not tax advice; consult a CPA.
Schools (NCES district)
- District
- Oxnard Union High
- NCES district ID
- 0629270
- Math proficiency
- 28% ▲ 7.00%
- Reading proficiency
- 51% ▲ 11.00%
- Median HH income
- $68,770
- Composite
- 35.79/100
- National rank
- #4835
- State rank
- #220 of 517 in CA
Livability — Oxnard
- Score
- 54/100
- State rank
- #905
- US rank
- #24028
Category grades
Schools grade is shown separately in the Schools card above.
Census & demographics
- Census place
- Oxnard, CA
- County
- Ventura County · 829,955 people
- City population
- 213,176
- Metro
- Oxnard-Thousand Oaks-Ventura, CA
- Population (ZIP)
- 58,192
- Household income
- $92,958
- Rent vs Own
- Severe rent burden
- 2012.0
Population outlook (Ventura County) Hauer SSP2
- Today (2025)
- 895,754 people
- By 2030
- 912,134 · +1.8%
- By 2040
- 931,454 · +4.0%
- By 2050
- 934,609 · +4.3%
- By 2075
- 924,899 · +3.3%
- By 2100
- 864,712 · -3.5%
Race, ethnicity, and origin ACS 2023
- Neighborhood character
- Predominantly Hispanic (79%)
- Race & ethnicity
- Hispanic / Latino 79% Two or more races 42% White 10% Asian 6% Native American 3% Black 2%
- Hispanic origin (detail)
- Mexican 74%
- Foreign-born
- 34% · Canada, Vietnam
- Languages at home
- 30% English-only · Spanish 63% Tagalog/Filipino 2% Vietnamese 1%
Political lean MEDSL · Ventura
- 2024 margin
- D (+15.1) · D 56.1% · R 41.0% · Other 2.9%
- 2008→2024 swing
- +2.8pp toward D · 2008: 12.3pp · 2024: 15.1pp
- All cycles
- 2024: D+15.1 2020: D+21.1 2016: D+16.8 2012: D+5.3 2008: D+12.3
Not yet ingested
- Civics
- —
Market trends
- HPI YoY
- ▼ -694.57%
- Current HPI
- 324.8799
- Rent YoY
- ▲ 1.23%
- Metro
- Oxnard-Thousand Oaks-Ventura, CA
- State GDP YoY
- ▲ 3.21%
- F500 in state
- 116
Industry mix (Fortune 500 HQ in CA)
| Industry | F500 HQs | Revenue |
|---|---|---|
| Technology | 27 | $1,492B |
|
||
| Financial Services | 3 | $174B |
|
||
| Retail | 3 | $44B |
|
||
| Insurance | 3 | $26B |
|
||
| Media / Entertainment | 2 | $115B |
|
||
| Pharmaceuticals / Biotech | 2 | $62B |
|
||
Price history
1 event — show timeline
- 2026-06-18 Listed $310,000 CRMLS
Property tax history
-10.7%/yrLatest (2025): $237 · +3.0% YoY. Source: county tax records.
Cash-flow waterfall
monthlySold comps — $/sqft
last 12 mo · ≤1 miLoading sold comps…