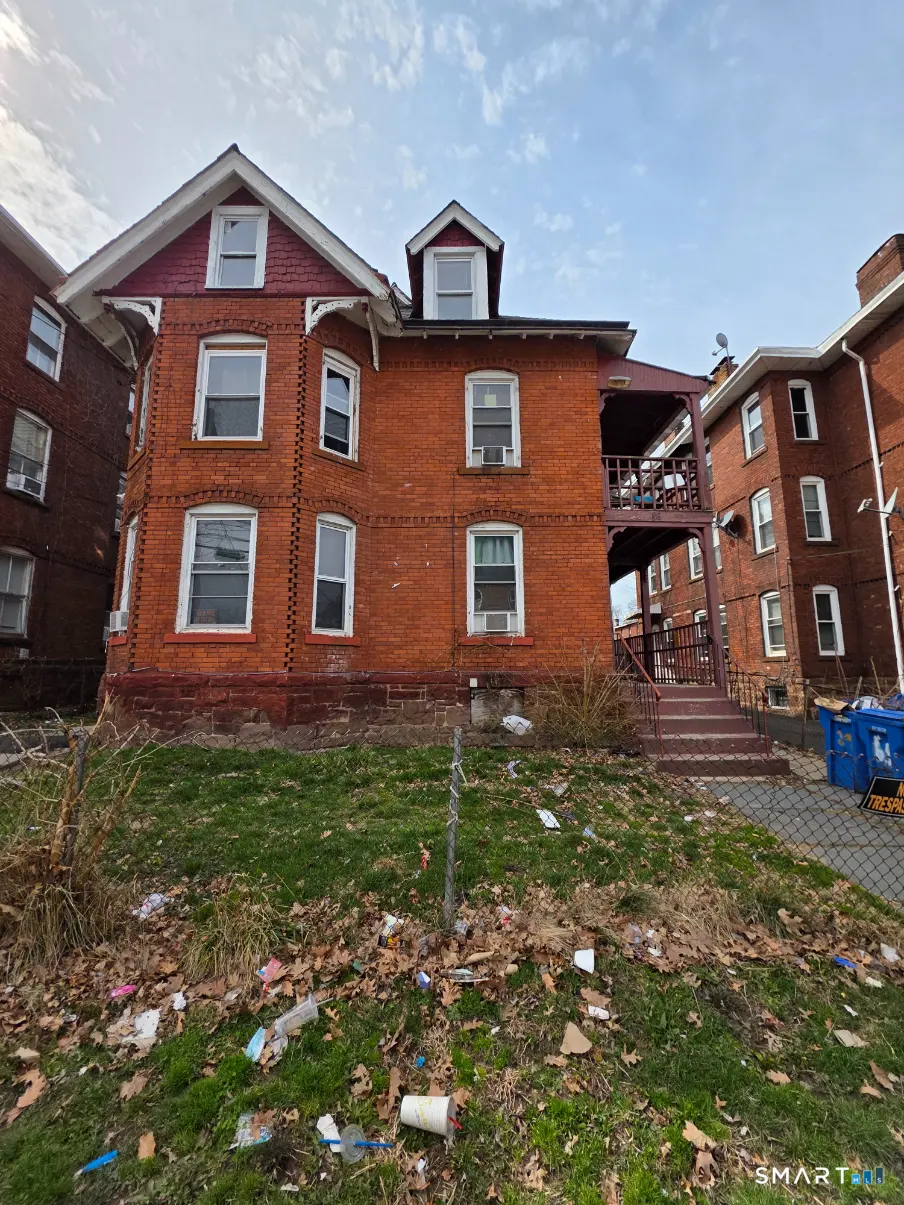
69 Babcock St
Hartford, CT 06106
$299,000B
6 bd · 3.0 ba ·
3,246 sqft ·
Built 1880
· MultiFamily
· Active
· 59 DOM
Cashflow @ list (25.0% down · 7.5%)
Estimated rent
$6,185/mo
Mortgage (P&I)
−$1,568
Tax + insurance
−$470
HOA
−$0
Vac / Maint / Mgmt
−$1,299
Net cashflow
$2,848/mo
Annual
$34,180/yr
Cap rate
17.72%
Cash-on-cash
40.83%
DSCR
2.82
1% rule
2.07%
Cash to close
$83,720
Investor read
- This is a 3 × 2-bed/1.0-bath units multifamily listed at $299k.
- At list price, monthly cash flow is $3k ($34k/yr) — positive. Per door: $949/mo.
- The deal already cash-flows at list — no discount required.
- Meets the 1% rule at list price ($6k rent vs $299k).
- It's been on market 59 days — a 3% lower offer ($290k) is reasonable based on typical stale-listing flexibility.
- Recommended offer: $290k (3.0% below list) — sets the bar for market timing.
- In year one you build about $6k of equity ($2k loan paydown + $4k appreciation (1.4% local appreciation)).
- Location reads 76/100 on livability (#58 in CT, #3,553 nationally) — a middle-class / working-renter tenant base. Strengths: amenities A+, commute A+, health & safety A+; Watch: crime F, employment F.
- Hartford School District (urban): math 13% / reading 21% proficiency, ranked #150 of 153 in CT (top 98%) — low school quality limits family demand, transient renter base, plan for 1-2y turnover; 84% free/reduced lunch — lower-income household profile, screen leases tightly.
- Zoned schools: Kennelly School (math 7% / reading 12%, grade F, #522 of 553 statewide, top 95%, 598 students, 85% FRL); Mcdonough Middle School (math 0% / reading 6%, grade F, #175 of 175 statewide, top 100%, 317 students, 83% FRL) — zoned schools at 84% FRL track the district average.
- Watch-outs: built in 1880 — expect roof / HVAC / electrical / plumbing capex.
- Market conditions: Rents rising (+2.4%/yr); 61 active listings in the ZIP; 1 comparable units currently listed for rent nearby; 1,867 units permitted in Capitol Planning Region in 2024 (1,399 in 5+ unit buildings).
- 8 sale attempts since 13y ago with the ask held roughly flat each time — persistent listings suggest the price (not the market) is what's stuck; bring a comps-based counter.
- Current owner paid $175k; list at $299k implies a 71% gain — meaningful room to come down on a strong offer.
- At projected returns (1.4% appreciation + 2.4% rent growth), your $84k cash investment doubles in ~3 years — after that, you're playing with house money.
- By year 6, paydown + projected appreciation supports a ~$34k cash-out refi (75% LTV) — recoverable capital for the next deal without selling this one.
- Climate carrying-cost: major wind risk, 27% chance of damaging wind over 30y; extreme-heat days projected 7→16/yr by 2055 (HVAC capex compounding) — expect insurance premiums to compound above CPI over the hold.
- At $6,185/mo this rent would consume 160% of the median local household income ($46k/yr) (locally 3400% of renters already pay >50% of income on rent) — very limited rent-growth headroom before tenants either downsize or default.
Questions for listing agent
- It's been on market 59 days. Have you received any prior offers? Is the seller open to a 3% concession, seller financing, or rate buy-down credit?
- Can we see the unit-by-unit rent roll, current vacancy, and any below-market leases? What's the average tenancy length?
- What capital expenditures (roof, boiler, parking lot, exteriors) have been made in the last 5 years, and what's planned in the next 2?
- Built in 1880 — when were the roof, HVAC, electrical panel, plumbing, and water heater last replaced?
- Is there a deadline driving the sale (1031 exchange, divorce, estate, relocation)? That informs how much negotiation room exists.
- Schools are D-rated, which usually means shorter tenancies and higher turnover. Who's the typical renter profile here, and what's been the actual vacancy rate?
- Crime grade is F in this area — have there been break-ins, vandalism, or insurance claims at this property in the last 3 years? What carrier currently insures it and at what premium?
- What's the average days-on-market for RENTAL listings here right now (not sales)? A rising rental-DOM trend means longer vacancies and softer asking-rent achievability than the comps imply.
CashFlowRE · CFR-3NTQX5C9QPNVHQ
· Data 17 h ago
cashflowre.app · 2026-05-29