 🏷️ Likely Rental
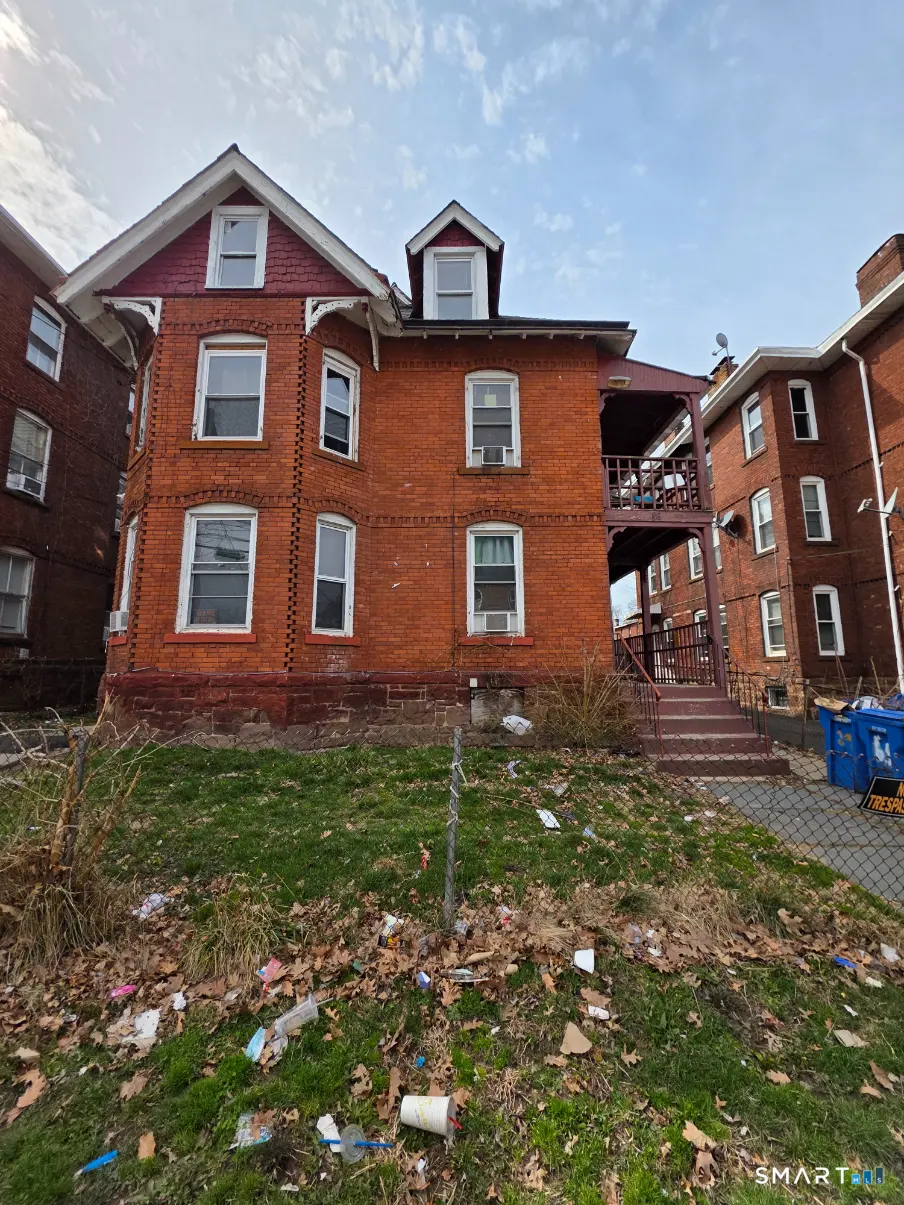
69 Babcock St · Hartford, CT
Flood risk 1/10 · Minimal
- FEMA flood zone
- X (unshaded)
- Chance of flooding over 30 yrs
- 0.0%
- Est. flood insurance / yr
- $473 – $860
Fire risk 1/10 · Minimal
- Est. fire insurance / yr
- $829 – $1,539
Heat risk 5/10 · Moderate
- Hot days now (above 97°F)
- 7 days/yr
- Hot days in 30 yrs
- 16 days/yr
Wind risk 6/10 · Moderate
- Chance of severe wind over 30 yrs
- 27.0%
Air-quality risk 3/10 · Minor
- Unhealthy air days now
- 3 days/yr
- Unhealthy air days in 30 yrs
- 4 days/yr
Risk factors via First Street. Map © Google.
Why this score? — see what drove the B grade
The composite is a weighted blend of 9 inputs, each scored 0–100. Each bar is that input's sub-score; the figure is the points it added to the 100-point composite (weight × sub-score).
- Cash flow +30.0/30.0
- 1% rule +10.0/10.0
- DSCR +10.0/10.0
- ARV discount +7.5/15.0
- Appreciation +5.7/10.0
- Livability +3.8/5.0
- Rent growth +3.1/5.0
- Condition / age +2.5/5.0
- Schools +1.4/10.0
$299,000
🖨 Deal sheet (PDF) 📄 Offer letter ✓ Due diligence
Multi-family units
County records classify this as Multi-Family (2-4 Unit). Listing-text estimate: 3 units. confirmed
Listing remarks
Great investment opportunity in Hartford! This three-family property offers strong income potential with three spacious units, each featuring comfortable layouts, generous living space, and ample natural light. Ideal for both owner-occupants and investors looking to expand their portfolio. Each unit provides multiple bedrooms, kitchens, and separate living areas, offering flexibility for tenants. The property includes off-street parking and a manageable yard, adding to tenant appeal. Conveniently located near local amenities, schools, shopping, and major highways, making commuting easy. Whether you're looking to generate steady rental income or live in one unit while renting the others, thi
Key facts
- Manageable yard
- Off street parking
- Conveniently located
Tags
Property features AI
Exterior
- Utilities: Public water connected; Public sewer connected; Natural gas for hot water and heating
- Home design: Multi-family property (3-family)
- Construction: Frame construction; Concrete foundation; Built as multi-family (living area reported at 3,246)
- Exterior features: Level lot; Brick exterior; Asphalt shingle roof
Interior
- Bedrooms: 6 bedrooms
- Bathrooms: 3 full bathrooms
- Heating & cooling: Hot water heating; Natural gas heating and hot water
- Interior features: 14 total rooms; Full, unfinished basement
Neighborhood map
What this means for you Summary
Snapshot
- This is a 3 × 2-bed/1.0-bath units multifamily listed at $299k.
Deal economics
- At list price, monthly cash flow is $3k ($34k/yr) — positive. Per door: $952/mo.
- The deal already cash-flows at list — no discount required.
- Meets the 1% rule at list price ($6k rent vs $299k).
- Recommended offer: $290k (3.0% below list) — sets the bar for market timing.
Location & tenants
- Location reads 76/100 on livability (#58 in CT, #3,553 nationally) — a middle-class / working-renter tenant base. Strengths: amenities A+, commute A+, health & safety A+; Watch: crime F, employment F.
- Hartford School District (urban): math 13% / reading 21% proficiency, ranked #150 of 153 in CT (top 98%) — low school quality limits family demand, transient renter base, plan for 1-2y turnover; 84% free/reduced lunch — lower-income household profile, screen leases tightly.
- Zoned schools: Kennelly School (math 7% / reading 12%, grade F, #522 of 553 statewide, top 95%, 598 students, 85% FRL); Mcdonough Middle School (math 0% / reading 6%, grade F, #175 of 175 statewide, top 100%, 317 students, 83% FRL) — zoned schools at 84% FRL track the district average.
- Market conditions: Rents rising (+2.4%/yr); 61 active listings in the ZIP; 1 comparable units currently listed for rent nearby; 1,867 units permitted in Capitol Planning Region in 2024 (1,399 in 5+ unit buildings).
- At $6,193/mo this rent would consume 160% of the median local household income ($46k/yr) (locally 3400% of renters already pay >50% of income on rent) — very limited rent-growth headroom before tenants either downsize or default.
Forward outlook
- In year one you build about $6k of equity ($2k loan paydown + $4k appreciation (1.4% local appreciation)).
- At projected returns (1.4% appreciation + 2.4% rent growth), your $84k cash investment doubles in ~3 years — after that, you're playing with house money.
- By year 6, paydown + projected appreciation supports a ~$34k cash-out refi (75% LTV) — recoverable capital for the next deal without selling this one.
Negotiation context
- It's been on market 59 days — a 3% lower offer ($290k) is reasonable based on typical stale-listing flexibility.
- 8 sale attempts since 13y ago with the ask held roughly flat each time — persistent listings suggest the price (not the market) is what's stuck; bring a comps-based counter.
- Current owner paid $175k; list at $299k implies a 71% gain — meaningful room to come down on a strong offer.
Risks & watch-outs
- Watch-outs: built in 1880 — expect roof / HVAC / electrical / plumbing capex.
- Climate carrying-cost: major wind risk, 27% chance of damaging wind over 30y; extreme-heat days projected 7→16/yr by 2055 (HVAC capex compounding) — expect insurance premiums to compound above CPI over the hold.
Questions for the listing agent
- It's been on market 59 days. Have you received any prior offers? Is the seller open to a 3% concession, seller financing, or rate buy-down credit?
- Can we see the unit-by-unit rent roll, current vacancy, and any below-market leases? What's the average tenancy length?
- What capital expenditures (roof, boiler, parking lot, exteriors) have been made in the last 5 years, and what's planned in the next 2?
- Built in 1880 — when were the roof, HVAC, electrical panel, plumbing, and water heater last replaced?
- Is there a deadline driving the sale (1031 exchange, divorce, estate, relocation)? That informs how much negotiation room exists.
- Schools are D-rated, which usually means shorter tenancies and higher turnover. Who's the typical renter profile here, and what's been the actual vacancy rate?
- Crime grade is F in this area — have there been break-ins, vandalism, or insurance claims at this property in the last 3 years? What carrier currently insures it and at what premium?
- What's the average days-on-market for RENTAL listings here right now (not sales)? A rising rental-DOM trend means longer vacancies and softer asking-rent achievability than the comps imply.
- What's the recent tenant-quality profile in this submarket — average credit score on applications, eviction rate, late-payment / NSF rate, and stable-employment percentage? A property-management company in the area should have these aggregated.
- How much new apartment / multifamily construction is in the pipeline within 1–3 miles? Heavy new supply (>2% of stock underway) typically softens rents 12–24 months out; light construction supports rent growth.
Investment metrics
- 1% rule
- 2.07% ✓
- Cap rate
- 17.75%
- Cash-on-cash
- 40.92%
- DSCR
- 2.82
- GRM
- 4.0
CMA / ARV
- ARV (median comp)
- $647,315
- List price
- $299,000
- Delta
- -53.81%
- Verdict
- UNDERPRICED
- Comps
- 4 within 2.0 mi
Projected returns pro-forma
1.38% appreciation · 2.37% rent growth · sell at horizon
- IRR
- 43.4%
- Equity multiple
- 3.26×
- Total profit
- $189,110
- Equity at exit
- $107,956
- IRR
- 44.6%
- Equity multiple
- 6.33×
- Total profit
- $446,355
- Equity at exit
- $148,128
Cash invested: $83,720 (down + closing). Projections, not guarantees.
Landlord ↔ Tenant lean methodology
- Overall (STATE)
- 27 Tenant-Leaning
- State Connecticut
- 27 Tenant-Leaning · D+7
- County
- — inherits STATE
- City
- — inherits STATE
ZIP-level market 06106
- Home prices YoY
- 0.4%
- Rents YoY
- 2.4%
- Active inventory
- 61
- Price-to-rent
- 12.1×
Monthly cashflow live
- Estimated rent
- $6,193 high interval (Pro) →
- Mortgage (P&I)
- −$1,568
- Tax from tax record
- −$345 /mo · $4,143/yr
- Insurance
- −$125
- HOA
- −$0
- Vacancy / Maint / Mgmt
- −$1,301
- Net cashflow
- $2,855
Break-even live
Sensitivity live
| Price | -10% $3,024 | -5% $2,939 | +0% $2,855 | +5% $2,770 | +10% $2,685 |
|---|---|---|---|---|---|
| Rent | -10% $2,365 | -5% $2,610 | +0% $2,855 | +5% $3,099 | +10% $3,344 |
| Rate | -1.0pp $3,005 | -0.5pp $2,931 | base $2,855 | +0.5pp $2,777 | +1.0pp $2,698 |
3-unit breakdown (identical units grouped — click to expand)
| Units | Beds | Baths | Est. rent |
|---|---|---|---|
| 3× units | 2 | 1 | $6,192 |
| #1 | 2 | 1 | $2,064 |
| #2 | 2 | 1 | $2,064 |
| #3 | 2 | 1 | $2,064 |
| Total (3 units) | $6,193 | ||
UW: 25.0% down · 7.5% · 30yr · 1.5% tax · 5.0% vac · 8.0% maint · 8.0% mgmt
Financing live
Cash to close
- Down payment
- $74,750
- Closing costs
- $8,970
- Reserves months
- —
- Total cash needed
- —
Loan-product check · same deal, 3 products live
Conventional
25% down · 7.5% · 30yr
- Down + closing
- —
- Monthly P&I
- —
- Monthly cashflow
- —
- DSCR
- —
- Eligible?
- —
Personal DTI + credit; lowest rate.
DSCR
20% down · 8.5% · 30yr
- Down + closing
- —
- Monthly P&I
- —
- Monthly cashflow
- —
- DSCR
- —
- Eligible?
- —
No personal income docs; deal must DSCR.
Hard money
10% down · 12.0% · 12mo
- Down + closing
- —
- Monthly P&I
- —
- Monthly cashflow
- —
- DSCR
- —
- Eligible?
- —
Short-term bridge; refi at stabilization.
Rent comps 1 comps
| Address | Beds | Baths | Sqft | Rent | $/sqft | DOM | Units | Dist |
|---|---|---|---|---|---|---|---|---|
| 260-262 Oxford St Fl 1 Hartford, CT | 5.0 | 2.5 | 2200 | $3,500 | $1.59 | 25d | 1 | 1.41mi |
Listing history 38 events
-
2026-06-22days on market $299,000 Active 59 DOM
-
2026-06-18days on market $299,000 Active 56 DOM
-
2026-06-17days on market $299,000 Active 55 DOM
-
2026-06-16days on market $299,000 Active 54 DOM
-
2026-06-15days on market $299,000 Active 53 DOM
-
2026-06-13days on market $299,000 Active 51 DOM
-
2026-06-13days on market $299,000 Active 50 DOM
-
2026-06-10days on market $299,000 Active 48 DOM
-
2026-06-09days on market $299,000 Active 47 DOM
-
2026-06-08days on market $299,000 Active 46 DOM
-
2026-06-07days on market $299,000 Active 45 DOM
-
2026-06-05days on market $299,000 Active 42 DOM
-
2026-06-03days on market $299,000 Active 41 DOM
-
2026-06-02days on market $299,000 Active 40 DOM
-
2026-06-01days on market $299,000 Active 39 DOM
-
2026-05-31days on market $299,000 Active 38 DOM
-
2026-04-23$299,000 Active 869-char remark
-
2024-09-01historical
-
2024-09-01historical
-
2024-08-07price $835,000
-
2024-08-07price $415,000
-
2024-08-07price $845,000
-
2024-08-07price $420,000
-
2024-07-25price $425,000
-
2024-07-25price $854,900
-
2024-07-10$439,900 Active
-
2024-07-10$884,900 Active
-
2019-03-01historical
-
2018-03-01$179,000
-
2016-10-08historical
-
2016-05-05$169,000
-
2015-08-30historical
-
2015-04-06$179,900
-
2014-12-05historical
-
2014-07-04$159,900
-
2013-10-17historical
-
2013-04-15$129,000
-
1987-09-09soldstatus $175,000
ⓘ Source: listings_history table (triggers on properties + properties_extension) + one-shot
backfill from property_details.listing_events for pre-trigger history.
Tax reassessment forecast CT · Partial reset (capped growth)
- Current annual tax
- $4,143 · $345/mo
- Projected year-2 tax
- $5,271 · $439/mo
- Expected delta
- +$1,128/yr (+$94/mo · 27.2%)
ⓘ Screening estimate from a state-policy table — verify with the county assessor before closing.
Climate risk First Street
- Flood 1/10 Low FEMA zone X (unshaded) · 0% chance over 30 yrs
- Wildfire 1/10 Low
- Heat 5/10 Major 7 d/yr ≥97°F today · 16 d/yr by 30 yrs out
- Wind 6/10 Major 27% chance of damaging wind over 30 yrs
- Air quality 3/10 Moderate 3 unhealthy d/yr today · 4 by 30 yrs out
Nearby sold comps map
Loading sold comps map…
Walkable amenities ~0.75 mi
Loading nearby amenities…
Taxation est. · year 1
- Rental income
- $74,316
- − Mortgage interest
- −$16,749
- − Property taxes
- −$4,143
- − Insurance
- −$1,495
- − Repairs & maintenance
- −$5,945
- − Management
- −$5,945
- − Depreciation
- −$8,698
- Taxable income
- $31,341
- Est. tax owed @ 24.0%
- −$7,522
- After-tax cash flow
- $26,734/yr
For passive investors: Depreciation is non-cash, so a rental often shows a tax loss while cash-flowing — sheltering income. Rental losses are passive: they offset passive income freely, and up to $25,000/yr can offset ordinary (W-2) income if you actively participate and your MAGI is under $100k (phasing out to $0 by $150k); unused losses carry forward. On sale, claimed depreciation is recaptured at up to 25%, and gains may owe capital-gains tax (a 1031 exchange can defer both). Figures are a year-1 estimate at your 24.0% rate — not tax advice; consult a CPA.
Schools (NCES district)
- District
- Hartford School District
- NCES district ID
- 0901920
- Math proficiency
- 13% ▼ -5.00%
- Reading proficiency
- 21% ▼ -6.00%
- Median HH income
- $30,521
- Composite
- 13.54/100
- National rank
- #9514
- State rank
- #150 of 153 in CT
Livability — Hartford
- Score
- 76/100
- State rank
- #58
- US rank
- #3553
Category grades
Schools grade is shown separately in the Schools card above.
Census & demographics
- Census place
- Hartford, CT
- County
- Hartford County · 754,208 people
- City population
- 121,162
- Metro
- Hartford-East Hartford-Middletown, CT
- Population (ZIP)
- 36,322
- Household income
- $46,304
- Rent vs Own
- Severe rent burden
- 3400.0
Population outlook (Capitol County) Hauer SSP2
- By 2040
- 1,063,519
Race, ethnicity, and origin ACS 2023
- Neighborhood character
- Diverse neighborhood (Simpson 0.58)
- Race & ethnicity
- Hispanic / Latino 60% Two or more races 25% Black 18% White 15% Asian 3%
- Hispanic origin (detail)
- Mexican 2% Puerto Rican 42% Dominican 6%
- Common ancestry
- Lithuanian 2% Russian 1% Romanian 1%
- Foreign-born
- 20% · Canada, Jamaica, China
- Languages at home
- 46% English-only · Spanish 47% Other Indo-European 3% Other Asian/Pacific 1%
Political lean MEDSL · Capitol
- 2024 margin
- Strong D (+21.9) · D 60.1% · R 38.2% · Other 1.7%
- All cycles
- 2024: D+21.9
Not yet ingested
- Civics
- —
Market trends
- HPI YoY
- ▲ 1.38%
- Current HPI
- 314.0899
- Rent YoY
- ▲ 2.37%
- Metro
- Hartford-East Hartford-Middletown, CT
- State GDP YoY
- ▲ 1.06%
- F500 in state
- 38
Industry mix (Fortune 500 HQ in CT)
| Industry | F500 HQs | Revenue |
|---|---|---|
| Industrial Machinery | 4 | $38B |
|
||
| Insurance | 3 | $71B |
|
||
| Financial Services | 2 | $25B |
|
||
| Transportation / Logistics | 2 | $18B |
|
||
| Healthcare | 1 | $247B |
|
||
| Telecommunications | 1 | $55B |
|
||
Price history
+70.9% since first listed22 events — show timeline
- 2026-04-23 Listed $299,000 Smart MLS
- 2024-09-01 Listing Removed — Smart MLS
- 2024-09-01 Listing Removed — Smart MLS
- 2024-08-07 Price Changed $835,000 Smart MLS
- 2024-08-07 Price Changed $415,000 Smart MLS
- 2024-08-07 Price Changed $845,000 Smart MLS
- 2024-08-07 Price Changed $420,000 Smart MLS
- 2024-07-25 Price Changed $425,000 Smart MLS
- 2024-07-25 Price Changed $854,900 Smart MLS
- 2024-07-10 Listed $884,900 Smart MLS
- 2024-07-10 Listed $439,900 Smart MLS
- 2019-03-01 Listing Removed — Smart MLS
- 2018-03-01 Listed $179,000 Smart MLS
- 2016-10-08 Listing Removed — Smart MLS
- 2016-05-05 Listed $169,000 Smart MLS
- 2015-08-30 Listing Removed — Smart MLS
- 2015-04-06 Listed $179,900 Smart MLS
- 2014-12-05 Listing Removed — Smart MLS
- 2014-07-04 Listed $159,900 Smart MLS
- 2013-10-17 Listing Removed — Smart MLS
- 2013-04-15 Listed $129,000 Smart MLS
- 1987-09-09 Sold (Public Records) $175,000 Public Records
Property tax history
+1.4%/yrLatest (2025): $4,143 · +0.0% YoY. Source: county tax records.
Cash-flow waterfall
monthlySold comps — $/sqft
last 12 mo · ≤1 miLoading sold comps…