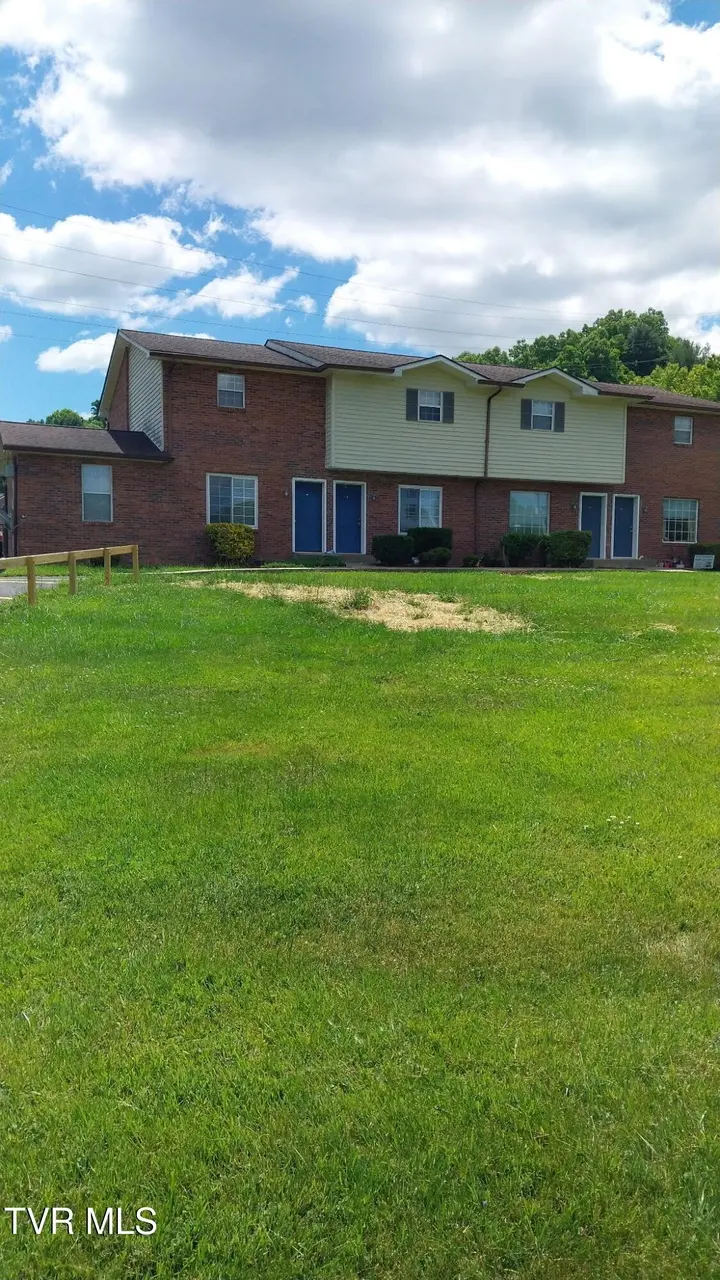
1830 Main St Unit A-1
Erwin, TN 37650
$1,400D-
3 bd · 2.0 ba ·
1,050 sqft ·
Built 1985
· SingleFamily
· Active
· 24 DOM
Cashflow @ list (25.0% down · 7.5%)
Estimated rent
$1,443/mo
Mortgage (P&I)
−$7
Tax + insurance
−$2
HOA
−$0
Vac / Maint / Mgmt
−$303
Net cashflow
$1,130/mo
Annual
$13,566/yr
Cap rate
975.28%
Cash-on-cash
3460.67%
DSCR
154.98
1% rule
103.09%
Cash to close
$392
Investor read
- This is a 3-bed/2.0-bath single-family listed at $1k.
- At list price, monthly cash flow is $1k ($14k/yr) — positive.
- The deal already cash-flows at list — no discount required.
- Meets the 1% rule at list price ($1k rent vs $1k).
- It's been on market 24 days — a 2% lower offer ($1k) is reasonable based on typical stale-listing flexibility.
- Recommended offer: $1k (1.5% below list) — sets the bar for market timing.
- Local home prices are declining (-3.0%/yr); year-one equity from $10 of loan paydown is wiped out by about $42 of value loss. Plan a longer hold.
- Location reads 61/100 on livability (#241 in TN) — a middle-class / working-renter tenant base. Strengths: cost of living A+, housing A+; Watch: crime F, amenities F, commute F.
- Unicoi County (town): math 25% / reading 26% proficiency, ranked #88 of 139 in TN (top 63%) — low school quality limits family demand, transient renter base, plan for 1-2y turnover.
- Zoned schools: Unicoi Elementary (math 22% / reading 22%, grade F, #601 of 952 statewide, top 66%, 317 students, 0% FRL); Unicoi Co Middle School (math 26% / reading 22%, grade F, #160 of 333 statewide, top 48%, 446 students, 0% FRL); Unicoi Co High School (math 8% / reading 34%, grade F, #174 of 332 statewide, top 52%, 713 students, 0% FRL) — zoned schools average 0% FRL vs 50% district-wide (50 pts lower); this property's tenant base skews higher-income than the district average.
- Market conditions: 71 active listings in the ZIP; 24 units permitted in Unicoi County in 2024 (0 in 5+ unit buildings).
- Unicoi County population projected at -16% by 2050 — secular population decline; favor cash flow + early exit over multi-decade hold.
- At projected returns (-3.0% appreciation + 3.0% rent growth), your $392 cash investment doubles in ~1 year — after that, you're playing with house money.
- Cap rate 975.3% vs local median 3.5% in Erwin — top-decile yield for the area; either an underpriced asset or a hidden risk that comps aren't pricing in. Stress-test before assuming the spread holds.
Questions for listing agent
- Is there a deadline driving the sale (1031 exchange, divorce, estate, relocation)? That informs how much negotiation room exists.
- Schools are F-rated, which usually means shorter tenancies and higher turnover. Who's the typical renter profile here, and what's been the actual vacancy rate?
- Crime grade is F in this area — have there been break-ins, vandalism, or insurance claims at this property in the last 3 years? What carrier currently insures it and at what premium?
- The area grade is low — what's the realistic commute time and amenity access for the typical tenant pool here? Any planned neighborhood developments (good or bad) we should know about?
- What's the average days-on-market for RENTAL listings here right now (not sales)? A rising rental-DOM trend means longer vacancies and softer asking-rent achievability than the comps imply.
- What's the recent tenant-quality profile in this submarket — average credit score on applications, eviction rate, late-payment / NSF rate, and stable-employment percentage? A property-management company in the area should have these aggregated.
- How much new for-sale + rental construction is in the pipeline within 1–3 miles? Heavy new supply typically softens prices + rents 12–24 months out; constrained supply supports both.
CashFlowRE · CFR-3P51G7F7RKPRPD
· Data 1 day ago
cashflowre.app · 2026-05-29