 🏷️ Likely Rental
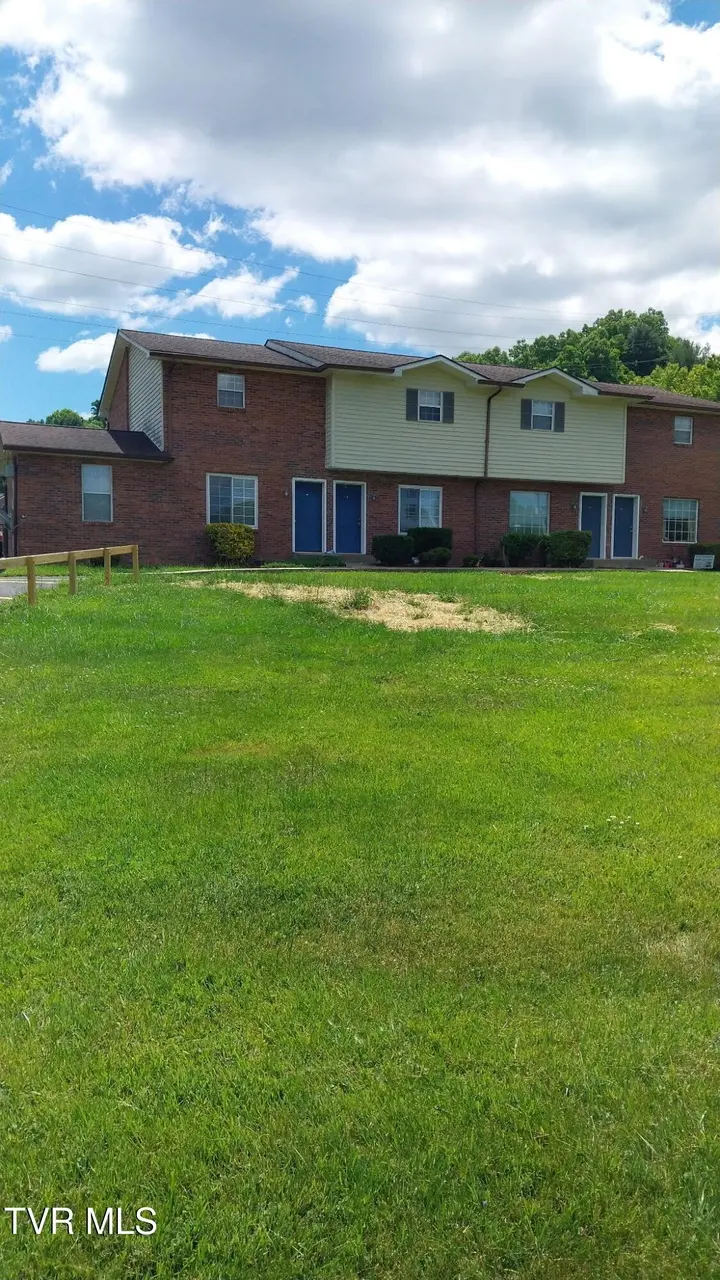
1830 Main St Unit A-1 · Erwin, TN
Flood risk No data
- FEMA flood zone
- —
- Chance of flooding over 30 yrs
- —
- Est. flood insurance / yr
- —
Fire risk No data
- Est. fire insurance / yr
- —
Heat risk No data
- Hot days now (above threshold)
- —
- Hot days in 30 yrs
- —
Wind risk No data
- Chance of severe wind over 30 yrs
- —
Air-quality risk No data
- Unhealthy air days now
- —
- Unhealthy air days in 30 yrs
- —
Risk factors via First Street. Map © Google.
Why this score? — see what drove the D- grade
The composite is a weighted blend of 9 inputs, each scored 0–100. Each bar is that input's sub-score; the figure is the points it added to the 100-point composite (weight × sub-score).
- Cash flow +15.0/30.0
- 1% rule +5.0/10.0
- DSCR +5.0/10.0
- Livability +3.1/5.0
- Rent growth +2.5/5.0
- Condition / age +2.5/5.0
- Schools +2.1/10.0
- Appreciation +0.9/10.0
- ARV discount +0.0/15.0
$1,400
🖨 Deal sheet 📄 Offer letter ✓ Due diligence
Listing remarks
3 Bedroom/2 Bath in beautiful Unicoi, TN. Water included, Central HVAC . No Pets
Key facts
- 6.25 acre lot
- Built 1985
- Listed 23 days
Property features AI
Finance
- Other: Zoning: A 1 / B 4; GPS directions available
Exterior
- Utilities: Public water
- Home design: Townhouse; Residential property
- Construction: Brick construction
- Exterior features: Bottom land topography; Approximately 6.25 acres
Interior
- Bathrooms: 2 full bathrooms
- Interior features: Central heating; Central air conditioning
Neighborhood map
What this means for you Summary
Snapshot
- This is a 3-bed/2.0-bath single-family listed at $1k.
Deal economics
- At list price, monthly cash flow is $1k ($14k/yr) — positive.
- The deal already cash-flows at list — no discount required.
- Meets the 1% rule at list price ($1k rent vs $1k).
- Recommended offer: $1k (1.5% below list) — sets the bar for market timing.
- Cap rate 975.3% vs local median 3.5% in Erwin — top-decile yield for the area; either an underpriced asset or a hidden risk that comps aren't pricing in. Stress-test before assuming the spread holds.
Location & tenants
- Location reads 61/100 on livability (#241 in TN) — a middle-class / working-renter tenant base. Strengths: cost of living A+, housing A+; Watch: crime F, amenities F, commute F.
- Unicoi County (town): math 25% / reading 26% proficiency, ranked #88 of 139 in TN (top 63%) — low school quality limits family demand, transient renter base, plan for 1-2y turnover.
- Zoned schools: Unicoi Elementary (math 22% / reading 22%, grade F, #601 of 952 statewide, top 66%, 317 students, 0% FRL); Unicoi Co Middle School (math 26% / reading 22%, grade F, #160 of 333 statewide, top 48%, 446 students, 0% FRL); Unicoi Co High School (math 8% / reading 34%, grade F, #174 of 332 statewide, top 52%, 713 students, 0% FRL) — zoned schools average 0% FRL vs 50% district-wide (50 pts lower); this property's tenant base skews higher-income than the district average.
- Market conditions: 71 active listings in the ZIP; 24 units permitted in Unicoi County in 2024 (0 in 5+ unit buildings).
Forward outlook
- Local home prices are declining (-3.0%/yr); year-one equity from $10 of loan paydown is wiped out by about $42 of value loss. Plan a longer hold.
- Unicoi County population projected at -16% by 2050 — secular population decline; favor cash flow + early exit over multi-decade hold.
- At projected returns (-3.0% appreciation + 3.0% rent growth), your $392 cash investment doubles in ~1 year — after that, you're playing with house money.
Negotiation context
- It's been on market 24 days — a 2% lower offer ($1k) is reasonable based on typical stale-listing flexibility.
Questions for the listing agent
- Is there a deadline driving the sale (1031 exchange, divorce, estate, relocation)? That informs how much negotiation room exists.
- Schools are F-rated, which usually means shorter tenancies and higher turnover. Who's the typical renter profile here, and what's been the actual vacancy rate?
- Crime grade is F in this area — have there been break-ins, vandalism, or insurance claims at this property in the last 3 years? What carrier currently insures it and at what premium?
- The area grade is low — what's the realistic commute time and amenity access for the typical tenant pool here? Any planned neighborhood developments (good or bad) we should know about?
- What's the average days-on-market for RENTAL listings here right now (not sales)? A rising rental-DOM trend means longer vacancies and softer asking-rent achievability than the comps imply.
- What's the recent tenant-quality profile in this submarket — average credit score on applications, eviction rate, late-payment / NSF rate, and stable-employment percentage? A property-management company in the area should have these aggregated.
- How much new for-sale + rental construction is in the pipeline within 1–3 miles? Heavy new supply typically softens prices + rents 12–24 months out; constrained supply supports both.
Investment metrics
- 1% rule
- 103.09% ✓
- Cap rate
- 975.28%
- Cash-on-cash
- 3460.67%
- DSCR
- 154.98
- GRM
- 0.1
CMA / ARV
- ARV (on-the-fly)
- $1,050
- Comps found
- 3
Show comp detail 3 sales within ~0.75 mi
| Address | Dist | Beds/Ba | Sqft | Sold | Price | $/sf | Match |
|---|---|---|---|---|---|---|---|
| 1830 Main St Unit A3 | 0.00mi | 2/1.5 (-1) | 1,050 (0%) | 11mo | $1,100 | $1 | 84 |
| 1832 Main St Unit B1 | 0.03mi | 3/2.0 | 1,175 (+12%) | 10mo | $1,450 | $1 | 70 |
| 1177 Johnson Loop Rd | 0.49mi | 2/2.0 (-1) | 1,200 (+14%) | 16mo | $255,300 | $213 | 35 |
Match score weights: distance 35% · size 25% · config 20% · recency 20%. Top-matched comps best support the ARV.
Projected returns pro-forma
-3.0% appreciation · 3.0% rent growth · sell at horizon
- IRR
- —
- Equity multiple
- 184.15×
- Total profit
- $71,796
- Equity at exit
- $209
- IRR
- —
- Equity multiple
- 397.23×
- Total profit
- $155,320
- Equity at exit
- $121
Cash invested: $392 (down + closing). Projections, not guarantees.
Landlord ↔ Tenant lean methodology
- Overall (STATE)
- 87 Strongly Landlord-Friendly
- State Tennessee
- 87 Strongly Landlord-Friendly · R+13
- County
- — inherits STATE
- City
- — inherits STATE
ZIP-level market 37650
- Home prices YoY
- -2.7%
- Active inventory
- 71
- Price-to-rent
- 0.1×
Monthly cashflow live
- Estimated rent
- $1,443 medium interval (Pro) →
- Mortgage (P&I)
- −$7
- Tax est. 1.5%
- −$2 /mo · $21/yr
- Insurance
- −$1
- HOA
- −$0
- Vacancy / Maint / Mgmt
- −$303
- Net cashflow
- $1,130
Break-even live
UW: 25.0% down · 7.5% · 30yr · 1.5% tax · 5.0% vac · 8.0% maint · 8.0% mgmt
Financing live
Cash to close
- Down payment
- $350
- Closing costs
- $42
- Reserves months
- —
- Total cash needed
- —
Loan-product check · same deal, 3 products live
Conventional
25% down · 7.5% · 30yr
- Down + closing
- —
- Monthly P&I
- —
- Monthly cashflow
- —
- DSCR
- —
- Eligible?
- —
Personal DTI + credit; lowest rate.
DSCR
20% down · 8.5% · 30yr
- Down + closing
- —
- Monthly P&I
- —
- Monthly cashflow
- —
- DSCR
- —
- Eligible?
- —
No personal income docs; deal must DSCR.
Hard money
10% down · 12.0% · 12mo
- Down + closing
- —
- Monthly P&I
- —
- Monthly cashflow
- —
- DSCR
- —
- Eligible?
- —
Short-term bridge; refi at stabilization.
Listing history 18 events
-
2026-06-19days on market $1,400 Active 24 DOM
-
2026-06-18days on market $1,400 Active 23 DOM
-
2026-06-17days on market $1,400 Active 22 DOM
-
2026-06-16days on market $1,400 Active 21 DOM
-
2026-06-15days on market $1,400 Active 20 DOM
-
2026-06-14days on market $1,400 Active 18 DOM
-
2026-06-13days on market $1,400 Active 17 DOM
-
2026-06-10days on market $1,400 Active 15 DOM
-
2026-06-09days on market $1,400 Active 14 DOM
-
2026-06-08days on market $1,400 Active 13 DOM
-
2026-06-07days on market $1,400 Active 12 DOM
-
2026-06-05days on market $1,400 Active 9 DOM
-
2026-06-03days on market $1,400 Active 8 DOM
-
2026-06-02days on market $1,400 Active 7 DOM
-
2026-06-01days on market $1,400 Active 6 DOM
-
2026-05-31days on market $1,400 Active 5 DOM
-
2026-05-30days on market $1,400 Active 4 DOM
-
2026-05-27$1,400 Active
ⓘ Source: listings_history table (triggers on properties + properties_extension) + one-shot
backfill from property_details.listing_events for pre-trigger history.
Nearby sold comps map
Loading sold comps map…
Walkable amenities ~0.75 mi
Loading nearby amenities…
Taxation est. · year 1
- Rental income
- $17,319
- − Mortgage interest
- −$78
- − Property taxes
- −$21
- − Insurance
- −$7
- − Repairs & maintenance
- −$1,386
- − Management
- −$1,386
- − Depreciation
- −$41
- Taxable income
- $14,401
- Est. tax owed @ 24.0%
- −$3,456
- After-tax cash flow
- $10,110/yr
For passive investors: Depreciation is non-cash, so a rental often shows a tax loss while cash-flowing — sheltering income. Rental losses are passive: they offset passive income freely, and up to $25,000/yr can offset ordinary (W-2) income if you actively participate and your MAGI is under $100k (phasing out to $0 by $150k); unused losses carry forward. On sale, claimed depreciation is recaptured at up to 25%, and gains may owe capital-gains tax (a 1031 exchange can defer both). Figures are a year-1 estimate at your 24.0% rate — not tax advice; consult a CPA.
Schools (NCES district)
- District
- Unicoi County
- NCES district ID
- 4704230
- Math proficiency
- 25% ▼ -8.00%
- Reading proficiency
- 26% ▼ -4.00%
- Median HH income
- $35,366
- Composite
- 21.08/100
- National rank
- #8443
- State rank
- #88 of 139 in TN
Livability — Erwin
- Score
- 61/100
- State rank
- #241
- US rank
- #17531
Category grades
Schools grade is shown separately in the Schools card above.
Census & demographics
- Population (ZIP)
- 13,109
Population outlook (Unicoi County) Hauer SSP2
- Today (2025)
- 17,083 people
- By 2030
- 16,570 · -3.0%
- By 2040
- 15,389 · -9.9%
- By 2050
- 14,270 · -16.5%
- By 2075
- 12,302 · -28.0%
- By 2100
- 10,812 · -36.7%
Race, ethnicity, and origin ACS 2023
- Neighborhood character
- Predominantly White (93%)
- Race & ethnicity
- White 93% Hispanic / Latino 5% Two or more races 5%
- Hispanic origin (detail)
- Mexican 4%
- Common ancestry
- Slovak 2% Romanian 1% Iranian 1%
- Foreign-born
- 1% · Canada
- Languages at home
- 95% English-only · Spanish 4%
Political lean MEDSL · Unicoi
- 2024 margin
- Solid R (+62.0) · D 18.5% · R 80.5% · Other 1.0%
- 2008→2024 swing
- -21.8pp toward R · 2008: -40.2pp · 2024: -62.0pp
- All cycles
- 2024: R+62.0 2020: R+60.0 2016: R+61.5 2012: R+44.1 2008: R+40.2
Not yet ingested
- Civics
- —
Market trends
- HPI YoY
- ▼ -8.18%
- Current HPI
- 290.1171
- Rent YoY
- —
- Metro
- —
- State GDP YoY
- ▲ 2.78%
- F500 in state
- 22
Industry mix (Fortune 500 HQ in TN)
| Industry | F500 HQs | Revenue |
|---|---|---|
| Healthcare | 3 | $91B |
|
||
| Retail | 3 | $72B |
|
||
| Transportation / Logistics | 1 | $88B |
|
||
| Paper / Packaging | 1 | $19B |
|
||
| Insurance | 1 | $13B |
|
||
| Energy | 1 | $12B |
|
||
Price history
1 event — show timeline
- 2026-05-27 Listed $1,400 TVRMLS
Cash-flow waterfall
monthlySold comps — $/sqft
last 12 mo · ≤1 miLoading sold comps…