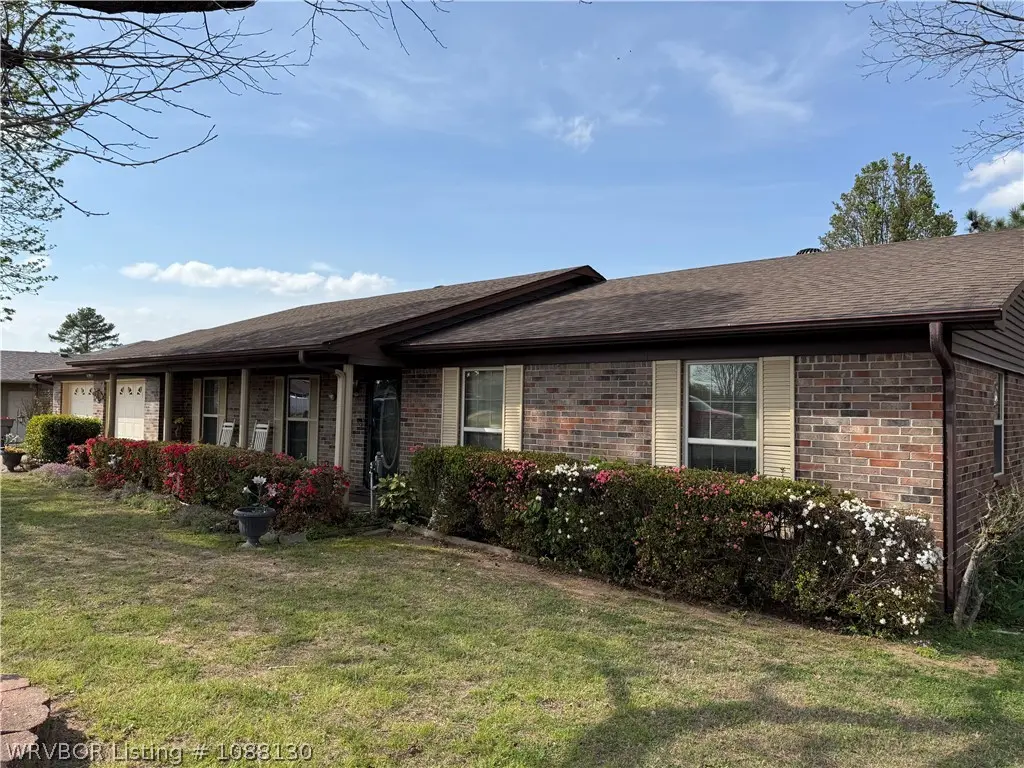
607 Spruce St
Van Buren, AR 72956
$1F
3 bd · 2.5 ba ·
2,035 sqft ·
Built —
· SingleFamily
· Pending
· 40 DOM
Cashflow @ list (25.0% down · 7.5%)
Estimated rent
$1,602/mo
Mortgage (P&I)
−$1,098
Tax + insurance
−$349
HOA
−$0
Vac / Maint / Mgmt
−$336
Net cashflow
$-181/mo
Annual
$-2,173/yr
Cap rate
5.25%
Cash-on-cash
-3.71%
DSCR
0.84
1% rule
0.77%
Cash to close
$58,614
Investor read
- This is a 3-bed/2.5-bath single-family listed at $1. Condition is rated average.
- At list price, monthly cash flow is $-181 ($-2k/yr) — negative.
- The deal already cash-flows at list — no discount required.
- Meets the 1% rule at list price ($2k rent vs $1).
- It's been on market 40 days — a 3% lower offer ($0) is reasonable based on typical stale-listing flexibility.
- Local home prices are declining (-3.0%/yr); year-one equity from $1k of loan paydown is wiped out by about $6k of value loss. Plan a longer hold.
- Location reads 69/100 on livability (#75 in AR) — a middle-class / working-renter tenant base. Strengths: cost of living A+, housing A+, health & safety A; Watch: employment D, crime D-, amenities F.
- Van Buren School District (suburban): math 41% / reading 41% proficiency, ranked #62 of 238 in AR (top 26%) — families likely to look elsewhere, expect single-tenant / working-renter base with shorter leases.
- Watch-outs: property tax is 314003.3% of price.
- Market conditions: Rents rising fast (+4.8%/yr); 247 active listings in the ZIP; 4 comparable units currently listed for rent nearby; rentals at typical pace (median 22d on market — plan ~3-4 weeks tenant-placement turnaround); 47 units permitted in Crawford County in 2024 (0 in 5+ unit buildings).
- Crawford County population projected to shrink 7% by 2050 — rents likely to lag national; underwrite the cash flow, not the appreciation.
- Climate carrying-cost: moderate wildfire risk; extreme-heat days projected 7→20/yr by 2055 (HVAC capex compounding) — expect insurance premiums to compound above CPI over the hold.
- Cap rate 5.3% vs local median 3.9% in Van Buren — top-decile yield for the area; either an underpriced asset or a hidden risk that comps aren't pricing in. Stress-test before assuming the spread holds.
- This rent runs 31% of the median local income ($63k/yr) — at the standard rent-burdened threshold; future hikes will face affordability resistance.
Questions for listing agent
- What do current leases actually rent for vs. the listed asking? Can we see a recent rent roll and the last 12 months of T-12 income?
- It's been on market 40 days. Have you received any prior offers? Is the seller open to a 5% concession, seller financing, or rate buy-down credit?
- Property tax is high relative to price — has the assessment been appealed recently, and will the sale trigger a re-assessment?
- Is there a deadline driving the sale (1031 exchange, divorce, estate, relocation)? That informs how much negotiation room exists.
- Crime grade is D in this area — have there been break-ins, vandalism, or insurance claims at this property in the last 3 years? What carrier currently insures it and at what premium?
- The area grade is low — what's the realistic commute time and amenity access for the typical tenant pool here? Any planned neighborhood developments (good or bad) we should know about?
- What's the average days-on-market for RENTAL listings here right now (not sales)? A rising rental-DOM trend means longer vacancies and softer asking-rent achievability than the comps imply.
- What's the recent tenant-quality profile in this submarket — average credit score on applications, eviction rate, late-payment / NSF rate, and stable-employment percentage? A property-management company in the area should have these aggregated.
Repairs flagged (vision-AI assessment)
- Major: kitchen cabinets — dated and worn
- Major: kitchen appliances — dated and worn
- Major: bathroom fixtures — dated and worn
- Major: bathroom tile — dated and worn
- Major: kitchen flooring — dated and worn
- Major: bathroom flooring — dated and worn
CashFlowRE · CFR-3RZM24FXBHXR3C
· Data 3 weeks ago
cashflowre.app · 2026-05-29