 🔨 Auction
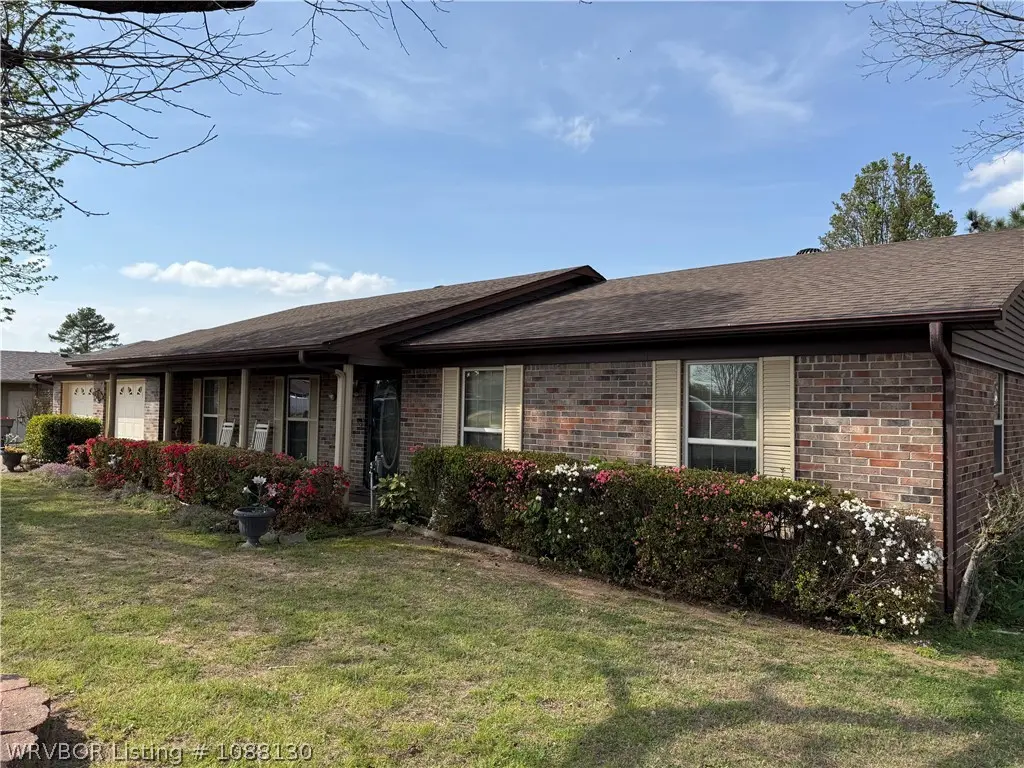
607 Spruce St · Van Buren, AR
Flood risk 1/10 · Minimal
- FEMA flood zone
- X (unshaded)
- Chance of flooding over 30 yrs
- 0.0%
- Est. flood insurance / yr
- $507 – $1,088
Fire risk 5/10 · Moderate
- Est. fire insurance / yr
- $1,499 – $2,785
Heat risk 6/10 · Moderate
- Hot days now (above 111°F)
- 7 days/yr
- Hot days in 30 yrs
- 20 days/yr
Wind risk 2/10 · Minimal
- Chance of severe wind over 30 yrs
- 2.0%
Air-quality risk 2/10 · Minimal
- Unhealthy air days now
- 1 days/yr
- Unhealthy air days in 30 yrs
- 1 days/yr
Risk factors via First Street. Map © Google.
Why this score? — see what drove the F grade
The composite is a weighted blend of 9 inputs, each scored 0–100. Each bar is that input's sub-score; the figure is the points it added to the 100-point composite (weight × sub-score).
- Cash flow +8.6/30.0
- ARV discount +7.5/15.0
- Rent growth +3.7/5.0
- Livability +3.5/5.0
- Schools +3.4/10.0
- Condition / age +2.8/5.0
- 1% rule +2.7/10.0
- DSCR +2.4/10.0
- Appreciation +0.0/10.0
$1
🖨 Deal sheet 📄 Offer letter ✓ Due diligence
Listing remarks MLS
Auction 5/5/26 @ 10 am. This lovely brick home offers approximately 2,035 square feet of comfortable living space, featuring three bedrooms and two and a half bathrooms. The interior is highlighted by a cozy wood-burning fireplace and the added security of a built-in safe room. Recent upgrades include new vinyl windows, while the exterior provides a double garage, a covered back porch, and a fenced backyard. Located in a prime area, the property also includes a 10’x12' storage building for extra convenience.
Key facts
- Built in safe room
- Storage building
- New vinyl windows
Tags
Neighborhood map
What this means for you Summary
Snapshot
- This is a 3-bed/2.5-bath single-family listed at $1. Condition is rated average.
Deal economics
- At list price, monthly cash flow is $-181 ($-2k/yr) — negative.
- The deal already cash-flows at list — no discount required.
- Meets the 1% rule at list price ($2k rent vs $1).
- Cap rate 5.3% vs local median 3.9% in Van Buren — top-decile yield for the area; either an underpriced asset or a hidden risk that comps aren't pricing in. Stress-test before assuming the spread holds.
Location & tenants
- Location reads 69/100 on livability (#75 in AR) — a middle-class / working-renter tenant base. Strengths: cost of living A+, housing A+, health & safety A; Watch: employment D, crime D-, amenities F.
- Van Buren School District (suburban): math 41% / reading 41% proficiency, ranked #62 of 238 in AR (top 26%) — families likely to look elsewhere, expect single-tenant / working-renter base with shorter leases.
- Market conditions: Rents rising fast (+4.8%/yr); 247 active listings in the ZIP; 4 comparable units currently listed for rent nearby; rentals at typical pace (median 21d on market — plan ~3-4 weeks tenant-placement turnaround); 47 units permitted in Crawford County in 2024 (0 in 5+ unit buildings).
- This rent runs 31% of the median local income ($63k/yr) — at the standard rent-burdened threshold; future hikes will face affordability resistance.
Forward outlook
- Local home prices are declining (-3.0%/yr); year-one equity from $1k of loan paydown is wiped out by about $6k of value loss. Plan a longer hold.
- Crawford County population projected to shrink 7% by 2050 — rents likely to lag national; underwrite the cash flow, not the appreciation.
Negotiation context
- It's been on market 40 days — a 3% lower offer ($0) is reasonable based on typical stale-listing flexibility.
Risks & watch-outs
- Watch-outs: property tax is 314003.3% of price.
- Climate carrying-cost: moderate wildfire risk; extreme-heat days projected 7→20/yr by 2055 (HVAC capex compounding) — expect insurance premiums to compound above CPI over the hold.
Questions for the listing agent
- What do current leases actually rent for vs. the listed asking? Can we see a recent rent roll and the last 12 months of T-12 income?
- It's been on market 40 days. Have you received any prior offers? Is the seller open to a 5% concession, seller financing, or rate buy-down credit?
- Property tax is high relative to price — has the assessment been appealed recently, and will the sale trigger a re-assessment?
- Is there a deadline driving the sale (1031 exchange, divorce, estate, relocation)? That informs how much negotiation room exists.
- Crime grade is D in this area — have there been break-ins, vandalism, or insurance claims at this property in the last 3 years? What carrier currently insures it and at what premium?
- The area grade is low — what's the realistic commute time and amenity access for the typical tenant pool here? Any planned neighborhood developments (good or bad) we should know about?
- What's the average days-on-market for RENTAL listings here right now (not sales)? A rising rental-DOM trend means longer vacancies and softer asking-rent achievability than the comps imply.
- What's the recent tenant-quality profile in this submarket — average credit score on applications, eviction rate, late-payment / NSF rate, and stable-employment percentage? A property-management company in the area should have these aggregated.
- How much new for-sale + rental construction is in the pipeline within 1–3 miles? Heavy new supply typically softens prices + rents 12–24 months out; constrained supply supports both.
Investment metrics
- 1% rule
- 0.77% ✗
- Cap rate
- 5.25%
- Cash-on-cash
- -3.71%
- DSCR
- 0.84
- GRM
- 10.9
CMA / ARV
- ARV (median comp)
- $209,336
- List price
- $1
- Delta
- -100.00%
- Verdict
- UNDERPRICED
- Comps
- 20 within 1.0 mi
Show comp detail 12 sales within ~0.75 mi
| Address | Dist | Beds/Ba | Sqft | Sold | Price | $/sf | Match |
|---|---|---|---|---|---|---|---|
| 607 Spruce St | 0.00mi | 3/2.5 | 2,035 (0%) | 0mo | $198,000 | $97 | 100 |
| 603 Spruce St | 0.04mi | 3/2.0 | 2,140 (+5%) | 7mo | $271,000 | $127 | 82 |
| 1509 N 11th St | 0.37mi | 3/2.0 | 2,008 (-1%) | 0mo | $255,000 | $127 | 78 |
| 1108 N 9th St | 0.30mi | 3/2.0 | 1,983 (-3%) | 7mo | $247,500 | $125 | 74 |
| 1416 N 10th St | 0.26mi | 3/2.5 | 2,148 (+6%) | 12mo | $274,900 | $128 | 69 |
| 907 N 9th St | 0.40mi | 3/2.0 | 1,781 (-12%) | 2mo | $190,000 | $107 | 56 |
| 1502 N 10th St | 0.31mi | 3/2.0 | 1,751 (-14%) | 7mo | $249,900 | $143 | 54 |
| 101 Prospect Ave | 0.72mi | 3/2.0 | 1,938 (-5%) | 4mo | $208,000 | $107 | 53 |
| 1113 N 8th St | 0.18mi | 4/2.0 (+1) | 2,317 (+14%) | 11mo | $238,000 | $103 | 52 |
| 817 Arkansas St | 0.46mi | 3/2.0 | 1,804 (-11%) | 7mo | $240,000 | $133 | 52 |
| 1100 Murta St | 0.65mi | 3/2.0 | 2,227 (+9%) | 2mo | $234,702 | $105 | 50 |
| 1206 Blueberry Hill St | 0.73mi | 3/2.0 | 2,174 (+7%) | 10mo | $268,000 | $123 | 44 |
Match score weights: distance 35% · size 25% · config 20% · recency 20%. Top-matched comps best support the ARV.
Projected returns pro-forma
-3.0% appreciation · 4.76% rent growth · sell at horizon
- IRR
- -20.6%
- Equity multiple
- 0.27×
- Total profit
- $-42,544
- Equity at exit
- $31,213
- IRR
- -10.3%
- Equity multiple
- 0.33×
- Total profit
- $-39,520
- Equity at exit
- $18,100
Cash invested: $58,614 (down + closing). Projections, not guarantees.
Landlord ↔ Tenant lean methodology
- Overall (STATE)
- 92 Strongly Landlord-Friendly
- State Arkansas
- 92 Strongly Landlord-Friendly · R+14
- County
- — inherits STATE
- City
- — inherits STATE
ZIP-level market 72956
- Rents YoY
- 4.8%
- Active inventory
- 247
Monthly cashflow live
- Estimated rent
- $1,602 medium interval (Pro) →
- Mortgage (P&I)
- −$1,098
- Tax est. 1.5%
- −$262 /mo · $3,140/yr
- Insurance
- −$87
- HOA
- −$0
- Vacancy / Maint / Mgmt
- −$336
- Net cashflow
- $-181
Break-even live
UW: 25.0% down · 7.5% · 30yr · 1.5% tax · 5.0% vac · 8.0% maint · 8.0% mgmt
Financing live
Cash to close
- Down payment
- $52,334
- Closing costs
- $6,280
- Reserves months
- —
- Total cash needed
- —
Loan-product check · same deal, 3 products live
Conventional
25% down · 7.5% · 30yr
- Down + closing
- —
- Monthly P&I
- —
- Monthly cashflow
- —
- DSCR
- —
- Eligible?
- —
Personal DTI + credit; lowest rate.
DSCR
20% down · 8.5% · 30yr
- Down + closing
- —
- Monthly P&I
- —
- Monthly cashflow
- —
- DSCR
- —
- Eligible?
- —
No personal income docs; deal must DSCR.
Hard money
10% down · 12.0% · 12mo
- Down + closing
- —
- Monthly P&I
- —
- Monthly cashflow
- —
- DSCR
- —
- Eligible?
- —
Short-term bridge; refi at stabilization.
Rent comps 4 comps
| Address | Beds | Baths | Sqft | Rent | $/sqft | DOM | Units | Dist |
|---|---|---|---|---|---|---|---|---|
| 306 Elfen Glen St Van Buren, AR | 3.0 | 2.0 | 1800 | $1,625 | $0.90 | 13d | 1 | 0.69mi |
| 506 Jenny Wren St Van Buren, AR | 3.0 | 2.0 | 1909 | $1,800 | $0.94 | 44d | 1 | 0.80mi |
| 927 Skyline Dr Van Buren, AR | 4.0 | 2.5 | 2511 | $2,100 | $0.84 | 21d | 1 | 1.37mi |
| 1518 Northridge Dr E Apt B Van Buren, AR | 3.0 | 2.5 | 1616 | $1,475 | $0.91 | 13d | 1 | 1.40mi |
Listing history 4 events
-
2026-05-12status Pending 519-char remark
Show marketing remark (519 chars)
Auction 5/5/26 @ 10 am. This lovely brick home offers approximately 2,035 square feet of comfortable living space, featuring three bedrooms and two and a half bathrooms. The interior is highlighted by a cozy wood-burning fireplace and the added security of a built-in safe room. Recent upgrades include new vinyl windows, while the exterior provides a double garage, a covered back porch, and a fenced backyard. Located in a prime area, the property also includes a 10’x12' storage building for extra convenience.
-
2026-03-30$1 Active 519-char remark
Show marketing remark (519 chars)
Auction 5/5/26 @ 10 am. This lovely brick home offers approximately 2,035 square feet of comfortable living space, featuring three bedrooms and two and a half bathrooms. The interior is highlighted by a cozy wood-burning fireplace and the added security of a built-in safe room. Recent upgrades include new vinyl windows, while the exterior provides a double garage, a covered back porch, and a fenced backyard. Located in a prime area, the property also includes a 10’x12' storage building for extra convenience.
-
2002-10-11soldstatus $109,000
-
1982-06-23soldstatus $56,000
ⓘ Source: listings_history table (triggers on properties + properties_extension) + one-shot
backfill from property_details.listing_events for pre-trigger history.
Climate risk First Street
- Flood 1/10 Low FEMA zone X (unshaded) · 0% chance over 30 yrs
- Wildfire 5/10 Major
- Heat 6/10 Major 7 d/yr ≥111°F today · 20 d/yr by 30 yrs out
- Wind 2/10 Low 2% chance of damaging wind over 30 yrs
- Air quality 2/10 Low 1 unhealthy d/yr today · 1 by 30 yrs out
Nearby sold comps map
Loading sold comps map…
Walkable amenities ~0.75 mi
Loading nearby amenities…
Taxation est. · year 1
- Rental income
- $19,224
- − Mortgage interest
- −$11,726
- − Property taxes
- −$3,140
- − Insurance
- −$1,047
- − Repairs & maintenance
- −$1,538
- − Management
- −$1,538
- − Depreciation
- −$6,090
- Taxable loss
- −$5,854
- Est. tax savings @ 24.0%
- +$1,405
- After-tax cash flow
- $-768/yr
For passive investors: Depreciation is non-cash, so a rental often shows a tax loss while cash-flowing — sheltering income. Rental losses are passive: they offset passive income freely, and up to $25,000/yr can offset ordinary (W-2) income if you actively participate and your MAGI is under $100k (phasing out to $0 by $150k); unused losses carry forward. On sale, claimed depreciation is recaptured at up to 25%, and gains may owe capital-gains tax (a 1031 exchange can defer both). Figures are a year-1 estimate at your 24.0% rate — not tax advice; consult a CPA.
Condition & rehab AI · 28 photos
This single-family home requires moderate renovations to improve its condition and increase its resale and rental value. The kitchen and bathrooms are in poor condition and need major repairs, while the exterior and landscaping are in average condition.
Repairs flagged
- Major kitchen cabinets — dated and worn
- Major kitchen appliances — dated and worn
- Major bathroom fixtures — dated and worn
- Major bathroom tile — dated and worn
- Major kitchen flooring — dated and worn
- Major bathroom flooring — dated and worn
Value-add opportunities
- Resale paint interior walls — fresh paint enhances curb appeal
- Resale replace kitchen cabinets and appliances — new cabinets and appliances improve functionality and aesthetics
- Resale replace bathroom fixtures and tile — new fixtures and tile improve functionality and aesthetics
- Resale replace kitchen flooring — new flooring improves functionality and aesthetics
- Resale replace bathroom flooring — new flooring improves functionality and aesthetics
Renovation cost estimate screening
| Repair item | Severity | Est. cost |
|---|---|---|
| kitchen cabinets · dated and worn | Major | $15,000–50,000 |
| kitchen appliances · dated and worn | Major | $15,000–50,000 |
| bathroom fixtures · dated and worn | Major | $15,000–50,000 |
| bathroom tile · dated and worn | Major | $15,000–50,000 |
| kitchen flooring · dated and worn | Major | $15,000–50,000 |
| bathroom flooring · dated and worn | Major | $15,000–50,000 |
| Total estimated repair cost · 6 items | $90,000–300,000 |
Value-add ROI direction
- Resale paint interior walls — fresh paint enhances curb appeal ↑
- Resale replace kitchen cabinets and appliances — new cabinets and appliances improve functionality and aesthetics ↑
- Resale replace bathroom fixtures and tile — new fixtures and tile improve functionality and aesthetics ↑
- Resale replace kitchen flooring — new flooring improves functionality and aesthetics ↑
- Resale replace bathroom flooring — new flooring improves functionality and aesthetics ↑
ⓘ Cost ranges are severity-bucket heuristics (US national rule-of-thumb). Get contractor quotes + a written scope before underwriting a rehab budget.
Schools (NCES district)
- District
- Van Buren School District
- NCES district ID
- 0513410
- Math proficiency
- 41% ▼ -8.00%
- Reading proficiency
- 41% ▼ -4.00%
- Median HH income
- $40,350
- Composite
- 34.41/100
- National rank
- #5201
- State rank
- #62 of 238 in AR
Livability — Van Buren
- Score
- 69/100
- State rank
- #75
- US rank
- #8898
Category grades
Schools grade is shown separately in the Schools card above.
Census & demographics
- Census place
- Van Buren, AR
- County
- Crawford County · 34,546 people
- City population
- 34,546
- Metro
- Fort Smith, AR-OK
- Population (ZIP)
- 34,546
- Household income
- $62,988
- Rent vs Own
- Severe rent burden
- 571.0
Population outlook (Crawford County) Hauer SSP2
- Today (2025)
- 62,108 people
- By 2030
- 61,519 · -0.9%
- By 2040
- 59,735 · -3.8%
- By 2050
- 57,521 · -7.4%
- By 2075
- 53,143 · -14.4%
- By 2100
- 49,596 · -20.1%
Race, ethnicity, and origin ACS 2023
- Neighborhood character
- Predominantly White (76%)
- Race & ethnicity
- White 76% Hispanic / Latino 12% Two or more races 11% Asian 2% Native American 1% Black 1%
- Hispanic origin (detail)
- Mexican 5%
- Common ancestry
- Lithuanian 1% Slovak 1% Romanian 1%
- Foreign-born
- 6% · Canada
- Languages at home
- 89% English-only · Spanish 10%
Political lean MEDSL · Crawford
- 2024 margin
- Solid R (+58.2) · D 19.9% · R 78.1% · Other 2.0%
- 2008→2024 swing
- -12.1pp toward R · 2008: -46.0pp · 2024: -58.2pp
- All cycles
- 2024: R+58.2 2020: R+56.7 2016: R+55.0 2012: R+49.9 2008: R+46.0
Not yet ingested
- Civics
- —
Market trends
- HPI YoY
- ▼ -156.05%
- Current HPI
- 221.3066
- Rent YoY
- ▲ 4.76%
- Metro
- Fort Smith, AR-OK
- State GDP YoY
- ▲ 3.80%
- F500 in state
- 10
Industry mix (Fortune 500 HQ in AR)
| Industry | F500 HQs | Revenue |
|---|---|---|
| Retail | 1 | $681B |
|
||
| Food / Agriculture | 1 | $53B |
|
||
| Retail / Energy | 1 | $22B |
|
||
| Transportation / Logistics | 1 | $12B |
|
||
| Energy | 1 | $4B |
|
||
Price history
+94.6% since first listed4 events — show timeline
- 2026-05-12 Pending — WRVBOR
- 2026-03-30 Listed $1 WRVBOR
- 2002-10-11 Sold (Public Records) $109,000 Public Records
- 1982-06-23 Sold (Public Records) $56,000 Public Records
Property tax history
+2.3%/yrLatest (2025): $1,373 · +0.0% YoY. Source: county tax records.
Cash-flow waterfall
monthlySold comps — $/sqft
last 12 mo · ≤1 miLoading sold comps…