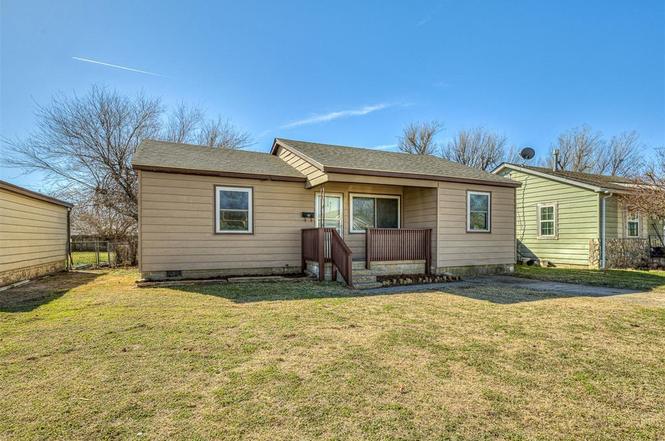
6910 NW 53rd St
Bethany, OK 73008
$169,900F
2 bd · 1.0 ba ·
747 sqft ·
Built 1951
· SingleFamily
· Active
· 129 DOM
Cashflow @ list (25.0% down · 7.5%)
Estimated rent
$1,027/mo
Mortgage (P&I)
−$891
Tax + insurance
−$164
HOA
−$0
Vac / Maint / Mgmt
−$216
Net cashflow
$-243/mo
Annual
$-2,918/yr
Cap rate
4.58%
Cash-on-cash
-6.13%
DSCR
0.73
1% rule
0.60%
Cash to close
$47,572
Investor read
- This is a 2-bed/1.0-bath single-family listed at $170k.
- At list price, monthly cash flow is $-243 ($-3k/yr) — negative.
- To cash-flow at today's rent, offer at most $127k (25.3% below list).
- To meet the 1% rule (rent ≥ 1% of price), the offer needs to be $103k (39.5% below list).
- It's been on market 129 days — a 12% lower offer ($150k) is reasonable based on typical stale-listing flexibility.
- Recommended offer: $103k (39.5% below list) — sets the bar for 1% rule.
- Local home prices are declining (-3.0%/yr); year-one equity from $1k of loan paydown is wiped out by about $5k of value loss. Plan a longer hold.
- Location reads 73/100 on livability (#18 in OK) — a middle-class / working-renter tenant base. Strengths: cost of living A+, housing A+, health & safety A-; Watch: employment C-, amenities F, commute F.
- Putnam City (urban): math 12% / reading 16% proficiency, ranked #227 of 270 in OK (top 84%) — low school quality limits family demand, transient renter base, plan for 1-2y turnover; 65% free/reduced lunch — lower-income household profile, screen leases tightly.
- Zoned schools: Central Es (math 9% / reading 12%, grade F, #692 of 845 statewide, top 82%, 601 students, 0% FRL); Putnam City Hs (math 12% / reading 23%, grade F, #307 of 447 statewide, top 69%, 2,014 students, 0% FRL) — zoned schools average 0% FRL vs 65% district-wide (65 pts lower); this property's tenant base skews higher-income than the district average.
- Watch-outs: built in 1951 — expect roof / HVAC / electrical / plumbing capex.
- Market conditions: Rents rising fast (+6.9%/yr); 75 active listings in the ZIP; 12 comparable units currently listed for rent nearby; rentals at typical pace (median 25d on market — plan ~3-4 weeks tenant-placement turnaround); 5,365 units permitted in Oklahoma County in 2024 (569 in 5+ unit buildings).
- Oklahoma County population projected at +41% by 2050 — long-run rental-demand tailwind backs the buy-and-hold thesis.
- 4 sale attempts since 19y ago with the ask held roughly flat each time — persistent listings suggest the price (not the market) is what's stuck; bring a comps-based counter.
- Current owner paid $115k; 48% above their basis — modest negotiation headroom, anchor on the comps not their cost.
- Climate carrying-cost: extreme-heat days projected 7→19/yr by 2055 (HVAC capex compounding) — expect insurance premiums to compound above CPI over the hold.
Questions for listing agent
- What do current leases actually rent for vs. the listed asking? Can we see a recent rent roll and the last 12 months of T-12 income?
- It's been on market 129 days. Have you received any prior offers? Is the seller open to a 40% concession, seller financing, or rate buy-down credit?
- Built in 1951 — when were the roof, HVAC, electrical panel, plumbing, and water heater last replaced?
- Why hasn't it sold? Are there any deal-killer items the seller is aware of (foundation, flood, title, zoning, code violations)?
- Is there a deadline driving the sale (1031 exchange, divorce, estate, relocation)? That informs how much negotiation room exists.
- Schools are D-rated, which usually means shorter tenancies and higher turnover. Who's the typical renter profile here, and what's been the actual vacancy rate?
- The area grade is low — what's the realistic commute time and amenity access for the typical tenant pool here? Any planned neighborhood developments (good or bad) we should know about?
- What's the average days-on-market for RENTAL listings here right now (not sales)? A rising rental-DOM trend means longer vacancies and softer asking-rent achievability than the comps imply.
CashFlowRE · CFR-3TE4Z652QG67R9
· Data 7 h ago
cashflowre.app · 2026-05-29