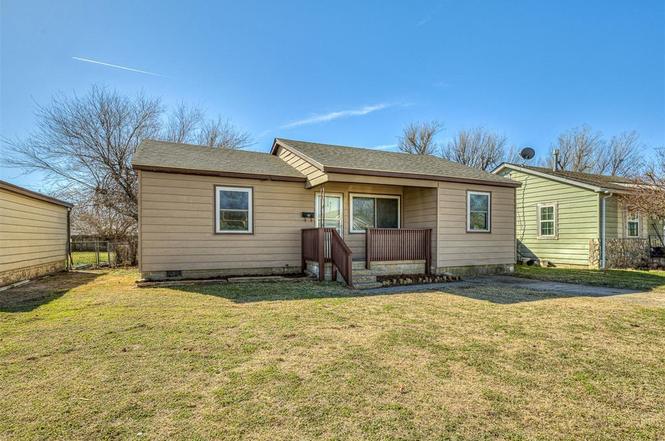
6910 NW 53rd St · Bethany, OK
Flood risk 1/10 · Minimal
- FEMA flood zone
- X (unshaded)
- Chance of flooding over 30 yrs
- 0.0%
- Est. flood insurance / yr
- $507 – $1,088
Fire risk 3/10 · Minor
- Est. fire insurance / yr
- $2,463 – $4,575
Heat risk 5/10 · Moderate
- Hot days now (above 106°F)
- 7 days/yr
- Hot days in 30 yrs
- 19 days/yr
Wind risk 2/10 · Minimal
- Chance of severe wind over 30 yrs
- 3.0%
Air-quality risk 2/10 · Minimal
- Unhealthy air days now
- 1 days/yr
- Unhealthy air days in 30 yrs
- 2 days/yr
Risk factors via First Street. Map © Google.
Why this score? — see what drove the F grade
The composite is a weighted blend of 9 inputs, each scored 0–100. Each bar is that input's sub-score; the figure is the points it added to the 100-point composite (weight × sub-score).
- Cash flow +7.1/30.0
- Rent growth +4.2/5.0
- Livability +3.7/5.0
- Condition / age +2.5/5.0
- DSCR +1.3/10.0
- Schools +1.3/10.0
- 1% rule +1.0/10.0
- ARV discount +0.0/15.0
- Appreciation +0.0/10.0
$169,900
🖨 Deal sheet (PDF) 📄 Offer letter ✓ Due diligence
Listing remarks MLS
Quiet Bethany street, this home has new insulation, indoor utilities, new carpet, fresh paint, HVAC is only 3 years old, fans in all the bedrooms, large backward with storage building.
Key facts
- Remodeled bathroom
- New appliances
- Remodeled property
Tags
Property features AI
Finance
- Other: Homestead exempt; Located in Ingram Hatley Fairview 3rd addition
- Financial info: Loan qualifying available; Not assumable
- HOA & community: No mandatory association dues
Exterior
- Utilities: Cable available; Electricity available; Natural gas available; Public utilities
- Home design: Single-family residence; One-level; North-facing; Residential property
- Construction: Frame and vinyl exterior; Architectural shingle roof; Conventional foundation; Built (existing)
- Exterior features: Covered porch; Interior lot
Interior
- Bedrooms: 3 bedrooms
- Bathrooms: 1 full bathroom
- Heating & cooling: Central gas heating
- Interior features: Ceiling fans
Neighborhood map
What this means for you Summary
Snapshot
- This is a 2-bed/1.0-bath single-family listed at $170k.
Deal economics
- At list price, monthly cash flow is $-243 ($-3k/yr) — negative.
- To cash-flow at today's rent, offer at most $127k (25.3% below list).
- To meet the 1% rule (rent ≥ 1% of price), the offer needs to be $103k (39.5% below list).
- Recommended offer: $103k (39.5% below list) — sets the bar for 1% rule.
Location & tenants
- Location reads 73/100 on livability (#18 in OK) — a middle-class / working-renter tenant base. Strengths: cost of living A+, housing A+, health & safety A-; Watch: employment C-, amenities F, commute F.
- Putnam City (urban): math 12% / reading 16% proficiency, ranked #227 of 270 in OK (top 84%) — low school quality limits family demand, transient renter base, plan for 1-2y turnover; 65% free/reduced lunch — lower-income household profile, screen leases tightly.
- Zoned schools: Central Es (math 9% / reading 12%, grade F, #692 of 845 statewide, top 82%, 601 students, 0% FRL); Putnam City Hs (math 12% / reading 23%, grade F, #307 of 447 statewide, top 69%, 2,014 students, 0% FRL) — zoned schools average 0% FRL vs 65% district-wide (65 pts lower); this property's tenant base skews higher-income than the district average.
- Market conditions: Rents rising fast (+6.9%/yr); 73 active listings in the ZIP; 12 comparable units currently listed for rent nearby; rentals at typical pace (median 25d on market — plan ~3-4 weeks tenant-placement turnaround); 5,365 units permitted in Oklahoma County in 2024 (569 in 5+ unit buildings).
Forward outlook
- Local home prices are declining (-3.0%/yr); year-one equity from $1k of loan paydown is wiped out by about $5k of value loss. Plan a longer hold.
- Oklahoma County population projected at +41% by 2050 — long-run rental-demand tailwind backs the buy-and-hold thesis.
Negotiation context
- It's been on market 126 days — a 12% lower offer ($150k) is reasonable based on typical stale-listing flexibility.
- 4 sale attempts since 19y ago with the ask held roughly flat each time — persistent listings suggest the price (not the market) is what's stuck; bring a comps-based counter.
- Current owner paid $115k; 48% above their basis — modest negotiation headroom, anchor on the comps not their cost.
Risks & watch-outs
- Watch-outs: built in 1951 — expect roof / HVAC / electrical / plumbing capex.
- Climate carrying-cost: extreme-heat days projected 7→19/yr by 2055 (HVAC capex compounding) — expect insurance premiums to compound above CPI over the hold.
Questions for the listing agent
- What do current leases actually rent for vs. the listed asking? Can we see a recent rent roll and the last 12 months of T-12 income?
- It's been on market 126 days. Have you received any prior offers? Is the seller open to a 40% concession, seller financing, or rate buy-down credit?
- Built in 1951 — when were the roof, HVAC, electrical panel, plumbing, and water heater last replaced?
- Why hasn't it sold? Are there any deal-killer items the seller is aware of (foundation, flood, title, zoning, code violations)?
- Is there a deadline driving the sale (1031 exchange, divorce, estate, relocation)? That informs how much negotiation room exists.
- Schools are D-rated, which usually means shorter tenancies and higher turnover. Who's the typical renter profile here, and what's been the actual vacancy rate?
- The area grade is low — what's the realistic commute time and amenity access for the typical tenant pool here? Any planned neighborhood developments (good or bad) we should know about?
- What's the average days-on-market for RENTAL listings here right now (not sales)? A rising rental-DOM trend means longer vacancies and softer asking-rent achievability than the comps imply.
- What's the recent tenant-quality profile in this submarket — average credit score on applications, eviction rate, late-payment / NSF rate, and stable-employment percentage? A property-management company in the area should have these aggregated.
- How much new for-sale + rental construction is in the pipeline within 1–3 miles? Heavy new supply typically softens prices + rents 12–24 months out; constrained supply supports both.
Investment metrics
- 1% rule
- 0.60% ✗
- Cap rate
- 4.58%
- Cash-on-cash
- -6.13%
- DSCR
- 0.73
- GRM
- 13.8
CMA / ARV
- ARV (on-the-fly)
- $129,231
- Comps found
- 12
Show comp detail 12 sales within ~0.75 mi
| Address | Dist | Beds/Ba | Sqft | Sold | Price | $/sf | Match |
|---|---|---|---|---|---|---|---|
| 6808 NW 53rd St | 0.09mi | 2/1.0 | 720 (-4%) | 6mo | $105,000 | $146 | 84 |
| 5202 N Rockwell Ave | 0.15mi | 2/1.0 | 725 (-3%) | 6mo | $104,000 | $143 | 83 |
| 6823 N NW 50th St | 0.20mi | 2/1.0 | 721 (-4%) | 10mo | $98,000 | $136 | 77 |
| 5107 N Dawson Ave | 0.17mi | 2/1.0 | 797 (+7%) | 9mo | $137,500 | $173 | 73 |
| 7003 NW 57th St | 0.28mi | 2/1.0 | 690 (-8%) | 2mo | $68,000 | $99 | 73 |
| 6904 NW 59th Ter | 0.44mi | 2/1.0 | 736 (-2%) | 9mo | $140,000 | $190 | 70 |
| 7002 NW 50th St | 0.23mi | 2/1.0 | 810 (+8%) | 8mo | $105,000 | $130 | 68 |
| 7007 NW 48th St | 0.33mi | 2/1.0 | 816 (+9%) | 6mo | $125,000 | $153 | 65 |
| 6021 NW 57th St | 0.59mi | 3/1.0 (+1) | 736 (-2%) | 1mo | $130,000 | $177 | 64 |
| 4908 N Central Rd | 0.40mi | 2/1.0 | 673 (-10%) | 6mo | $125,000 | $186 | 60 |
| 4900 Beaver | 0.33mi | 2/1.0 | 642 (-14%) | 10mo | $114,900 | $179 | 52 |
| 6109 NW 55th St | 0.50mi | 3/1.5 (+1) | 811 (+9%) | 10mo | $159,000 | $196 | 47 |
Match score weights: distance 35% · size 25% · config 20% · recency 20%. Top-matched comps best support the ARV.
Projected returns pro-forma
-3.0% appreciation · 6.93% rent growth · sell at horizon
- IRR
- -23.2%
- Equity multiple
- 0.18×
- Total profit
- $-38,853
- Equity at exit
- $25,333
- IRR
- -10.7%
- Equity multiple
- 0.26×
- Total profit
- $-35,220
- Equity at exit
- $14,690
Cash invested: $47,572 (down + closing). Projections, not guarantees.
Landlord ↔ Tenant lean methodology
- Overall (STATE)
- 83 Strongly Landlord-Friendly
- State Oklahoma
- 83 Strongly Landlord-Friendly · R+20
- County
- — inherits STATE
- City
- — inherits STATE
ZIP-level market 73008
- Rents YoY
- 6.9%
- Active inventory
- 73
- Price-to-rent
- 13.8×
Monthly cashflow live
- Estimated rent
- $1,027 high interval (Pro) →
- Mortgage (P&I)
- −$891
- Tax from tax record
- −$93 /mo · $1,114/yr
- Insurance
- −$71
- HOA
- −$0
- Vacancy / Maint / Mgmt
- −$216
- Net cashflow
- $-243
Break-even live
Sensitivity live
| Price | -10% $-147 | -5% $-195 | +0% $-243 | +5% $-291 | +10% $-339 |
|---|---|---|---|---|---|
| Rent | -10% $-324 | -5% $-284 | +0% $-243 | +5% $-203 | +10% $-162 |
| Rate | -1.0pp $-158 | -0.5pp $-200 | base $-243 | +0.5pp $-287 | +1.0pp $-332 |
UW: 25.0% down · 7.5% · 30yr · 1.5% tax · 5.0% vac · 8.0% maint · 8.0% mgmt
Financing live
Cash to close
- Down payment
- $42,475
- Closing costs
- $5,097
- Reserves months
- —
- Total cash needed
- —
Loan-product check · same deal, 3 products live
Conventional
25% down · 7.5% · 30yr
- Down + closing
- —
- Monthly P&I
- —
- Monthly cashflow
- —
- DSCR
- —
- Eligible?
- —
Personal DTI + credit; lowest rate.
DSCR
20% down · 8.5% · 30yr
- Down + closing
- —
- Monthly P&I
- —
- Monthly cashflow
- —
- DSCR
- —
- Eligible?
- —
No personal income docs; deal must DSCR.
Hard money
10% down · 12.0% · 12mo
- Down + closing
- —
- Monthly P&I
- —
- Monthly cashflow
- —
- DSCR
- —
- Eligible?
- —
Short-term bridge; refi at stabilization.
Rent comps 12 comps
| Address | Beds | Baths | Sqft | Rent | $/sqft | DOM | Units | Dist |
|---|---|---|---|---|---|---|---|---|
| 6811 NW 49th St Bethany, OK | 2.0 | 1.0 | 680 | $1,075 | $1.58 | 11d | 1 | 0.26mi |
| 5617 N Donald Ave Oklahoma City, OK | 2.0 | 1.0 | 720 | $1,045 | $1.45 | 17d | 1 | 0.47mi |
| 4207 1/2 N Beaver Ave Bethany, OK | 2.0 | 1.0 | 560 | $850 | $1.52 | 24d | 1 | 0.72mi |
| 4207 N Beaver Ave Bethany, OK | 2.0 | 1.0 | 560 | $850 | $1.52 | 24d | 1 | 0.72mi |
| 4007 N Rockwell Ave Bethany, OK | 2.0 | 1.0 | 636 | $875 | $1.38 | 24d | 1 | 0.90mi |
| 4005 N Rockwell Ave Bethany, OK | 2.0 | 1.0 | 636 | $900 | $1.42 | 24d | 1 | 0.91mi |
| 3901 N Rockwell Ave Bethany, OK | 1.0–2.0 | 1.0 | 662 | $775 | $1.17 | 12d | 2 | 1.04mi |
| 4500 N MacArthur Blvd Warr Acres, OK | 1.0–2.0 | 1.0 | 755 | $770 | $1.02 | 3d | 1 | 1.12mi |
| 6103 NW 63rd St Oklahoma City, OK | 1.0 | 1.0 | 696 | $795 | $1.14 | 24d | 1 | 1.12mi |
| 5912 NW 41st St Unit 29 Warr Acres, OK | 1.0 | 1.0 | 552 | $850 | $1.54 | 24d | 1 | 1.17mi |
| 5577 NW 50th St Oklahoma City, OK | 1.0–2.0 | 1.0–2.0 | 725 | $1,149 | $1.58 | 4d | 6 | 1.29mi |
| 4301 N Wall St Warr Acres, OK | 3.0 | 1.0 | 747 | $1,775 | $2.38 | 20d | 1 | 1.47mi |
Listing history 24 events
-
2026-06-18days on market $169,900 Active 126 DOM
-
2026-06-17days on market $169,900 Active 125 DOM
-
2026-06-16days on market $169,900 Active 124 DOM
-
2026-06-15days on market $169,900 Active 123 DOM
-
2026-06-13days on market $169,900 Active 121 DOM
-
2026-06-13days on market $169,900 Active 120 DOM
-
2026-06-09days on market $169,900 Active 117 DOM
-
2026-06-08days on market $169,900 Active 116 DOM
-
2026-06-07days on market $169,900 Active 115 DOM
-
2026-06-03days on market $169,900 Active 111 DOM
-
2026-06-02days on market $169,900 Active 110 DOM
-
2026-06-01days on market $169,900 Active 109 DOM
-
2026-05-31days on market $169,900 Active 108 DOM
-
2026-02-27price $169,900
-
2026-02-12$175,000 Active
-
2025-12-16soldstatus $115,000
-
2014-09-09historical
-
2014-07-15$79,900
-
2009-08-06soldstatus $67,000
-
2009-07-03soldstatus $67,000 184-char remark
Show marketing remark (184 chars)
Quiet Bethany street, this home has new insulation, indoor utilities, new carpet, fresh paint, HVAC is only 3 years old, fans in all the bedrooms, large backward with storage building.
-
2009-04-30$69,000 184-char remark
Show marketing remark (184 chars)
Quiet Bethany street, this home has new insulation, indoor utilities, new carpet, fresh paint, HVAC is only 3 years old, fans in all the bedrooms, large backward with storage building.
-
2008-01-01historical
-
2007-09-26$74,900
-
1994-05-17soldstatus $36,500
ⓘ Source: listings_history table (triggers on properties + properties_extension) + one-shot
backfill from property_details.listing_events for pre-trigger history.
Tax reassessment forecast OK · Resets to sale price
- Current annual tax
- $1,114 · $93/mo
- Projected year-2 tax
- $1,529 · $127/mo
- Expected delta
- +$415/yr (+$35/mo · 37.2%)
ⓘ Screening estimate from a state-policy table — verify with the county assessor before closing.
Climate risk First Street
- Flood 1/10 Low FEMA zone X (unshaded) · 0% chance over 30 yrs
- Wildfire 3/10 Moderate
- Heat 5/10 Major 7 d/yr ≥106°F today · 19 d/yr by 30 yrs out
- Wind 2/10 Low 3% chance of damaging wind over 30 yrs
- Air quality 2/10 Low 1 unhealthy d/yr today · 2 by 30 yrs out
Nearby sold comps map
Loading sold comps map…
Walkable amenities ~0.75 mi
Loading nearby amenities…
Taxation est. · year 1
- Rental income
- $12,326
- − Mortgage interest
- −$9,517
- − Property taxes
- −$1,114
- − Insurance
- −$850
- − Repairs & maintenance
- −$986
- − Management
- −$986
- − Depreciation
- −$4,943
- Taxable loss
- −$6,069
- Est. tax savings @ 24.0%
- +$1,457
- After-tax cash flow
- $-1,461/yr
For passive investors: Depreciation is non-cash, so a rental often shows a tax loss while cash-flowing — sheltering income. Rental losses are passive: they offset passive income freely, and up to $25,000/yr can offset ordinary (W-2) income if you actively participate and your MAGI is under $100k (phasing out to $0 by $150k); unused losses carry forward. On sale, claimed depreciation is recaptured at up to 25%, and gains may owe capital-gains tax (a 1031 exchange can defer both). Figures are a year-1 estimate at your 24.0% rate — not tax advice; consult a CPA.
Schools (NCES district)
- District
- Putnam City
- NCES district ID
- 4025290
- Math proficiency
- 12% ▼ -18.00%
- Reading proficiency
- 16% ▼ -14.00%
- Median HH income
- $46,657
- Composite
- 12.61/100
- National rank
- #9614
- State rank
- #227 of 270 in OK
Livability — Bethany
- Score
- 73/100
- State rank
- #18
- US rank
- #5466
Category grades
Schools grade is shown separately in the Schools card above.
Census & demographics
- Census place
- Bethany, OK
- County
- Oklahoma County · 771,644 people
- City population
- 21,472
- Metro
- Oklahoma City, OK
- Population (ZIP)
- 21,472
- Household income
- $57,459
- Rent vs Own
- Severe rent burden
- 892.0
Population outlook (Oklahoma County) Hauer SSP2
- Today (2025)
- 911,875 people
- By 2030
- 982,413 · +7.7%
- By 2040
- 1,130,468 · +24.0%
- By 2050
- 1,288,422 · +41.3%
- By 2075
- 1,711,482 · +87.7%
- By 2100
- 2,088,448 · +129.0%
Race, ethnicity, and origin ACS 2023
- Neighborhood character
- Diverse neighborhood (Simpson 0.62)
- Race & ethnicity
- White 57% Hispanic / Latino 21% Two or more races 14% Black 11% Native American 4%
- Hispanic origin (detail)
- Mexican 19%
- Common ancestry
- Italian 4% Iranian 2% Slovak 2%
- Foreign-born
- 9% · Canada, Vietnam
- Languages at home
- 81% English-only · Spanish 17% French/Haitian/Cajun 1% Vietnamese 1%
Political lean MEDSL · Oklahoma
- 2024 margin
- Toss-up / Even · D 48.0% · R 49.7% · Other 2.3%
- 2008→2024 swing
- +15.1pp toward D · 2008: -16.8pp · 2024: -1.7pp
- All cycles
- 2024: R+1.7 2020: R+1.1 2016: R+10.5 2012: R+16.7 2008: R+16.8
Not yet ingested
- Civics
- —
Market trends
- HPI YoY
- ▼ -140.71%
- Current HPI
- 251.1185
- Rent YoY
- ▲ 6.93%
- Metro
- Oklahoma City, OK
- State GDP YoY
- ▲ 1.55%
- F500 in state
- 6
Industry mix (Fortune 500 HQ in OK)
| Industry | F500 HQs | Revenue |
|---|---|---|
| Energy | 3 | $48B |
|
||
Price history
+365.5% since first listed11 events — show timeline
- 2026-02-27 Price Changed $169,900 MLSOK
- 2026-02-12 Listed $175,000 MLSOK
- 2025-12-16 Sold (Public Records) $115,000 Public Records
- 2014-09-09 Listing Removed — MLSOK
- 2014-07-15 Listed $79,900 MLSOK
- 2009-08-06 Sold (Public Records) $67,000 Public Records
- 2009-07-03 Sold (MLS) $67,000 MLSOK
- 2009-04-30 Listed $69,000 MLSOK
- 2008-01-01 Listing Removed — MLSOK
- 2007-09-26 Listed $74,900 MLSOK
- 1994-05-17 Sold (Public Records) $36,500 Public Records
Property tax history
+6.1%/yrLatest (2025): $1,114 · +6.4% YoY. Source: county tax records.
Cash-flow waterfall
monthlySold comps — $/sqft
last 12 mo · ≤1 miLoading sold comps…