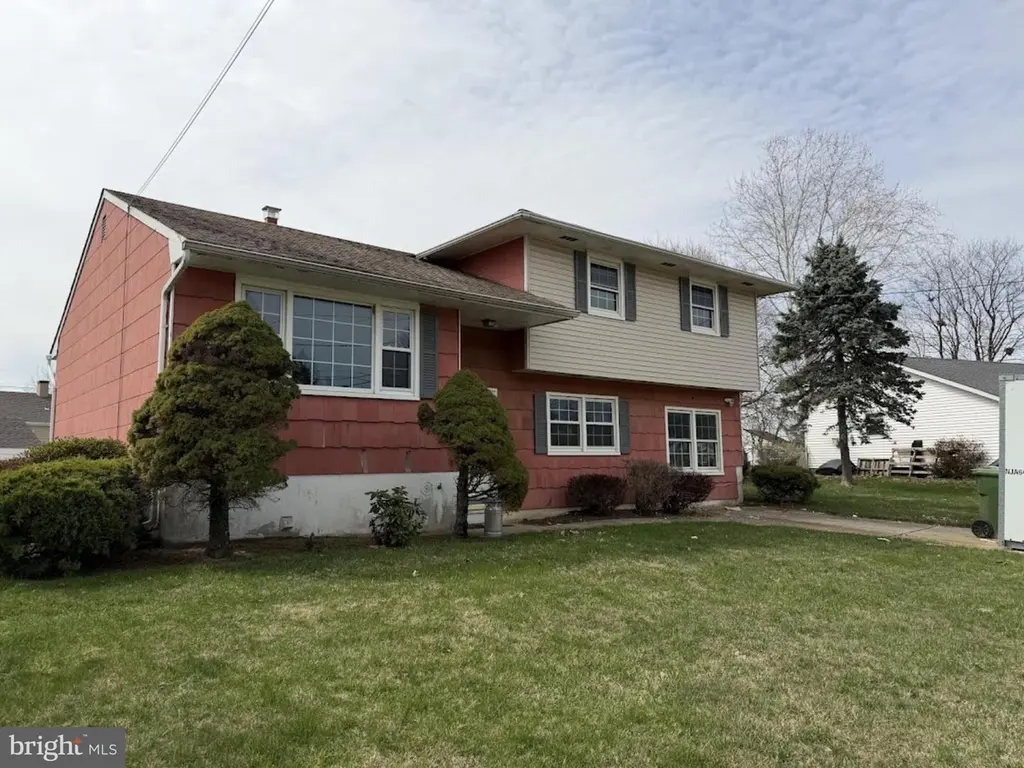
5 Clive Ct
Ewing, NJ 08638
$275,000C
4 bd · 1.5 ba ·
1,661 sqft ·
Built 1970
· SingleFamily
· Active
· 55 DOM
Cashflow @ list (25.0% down · 7.5%)
Estimated rent
$3,208/mo
Mortgage (P&I)
−$1,442
Tax + insurance
−$789
HOA
−$0
Vac / Maint / Mgmt
−$674
Net cashflow
$303/mo
Annual
$3,637/yr
Cap rate
7.62%
Cash-on-cash
4.72%
DSCR
1.21
1% rule
1.17%
Cash to close
$77,000
Investor read
- This is a 4-bed/1.5-bath single-family listed at $275k.
- At list price, monthly cash flow is $303 ($4k/yr) — positive.
- The deal already cash-flows at list — no discount required.
- Meets the 1% rule at list price ($3k rent vs $275k).
- It's been on market 55 days — a 3% lower offer ($267k) is reasonable based on typical stale-listing flexibility.
- Recommended offer: $267k (3.0% below list) — sets the bar for market timing.
- Local home prices are declining (-3.0%/yr); year-one equity from $2k of loan paydown is wiped out by about $8k of value loss. Plan a longer hold.
- Location reads: area grade C — affects rentability + tenant quality, not the cash-flow math above.
- Ewing Township School District (suburban): math 16% / reading 37% proficiency, ranked #358 of 472 in NJ (top 76%) — low school quality limits family demand, transient renter base, plan for 1-2y turnover.
- Zoned schools: William L Antheil Elementary School (math 13% / reading 23%, grade F, #1,049 of 1,303 statewide, top 81%, 692 students, 46% FRL); Gilmore J Fisher Middle School (math 17% / reading 39%, grade F, #335 of 431 statewide, top 79%, 791 students, 50% FRL); Ewing High School (math 21% / reading 46%, grade F, #251 of 399 statewide, top 64%, 1,109 students, 43% FRL).
- Watch-outs: property tax is 2.9% of price.
- Market conditions: Rents rising (+3.3%/yr); 83 active listings in the ZIP; 7 comparable units currently listed for rent nearby; rentals at typical pace (median 16d on market — plan ~3-4 weeks tenant-placement turnaround); 2,256 units permitted in Mercer County in 2024 (1,303 in 5+ unit buildings).
- Mercer County population projected at +4% by 2050 — modest demand growth; plan on rents tracking national, not racing it.
- Climate carrying-cost: major wind risk, 27% chance of damaging wind over 30y; extreme-heat days projected 7→15/yr by 2055 (HVAC capex compounding) — expect insurance premiums to compound above CPI over the hold.
- At $3,208/mo this rent would consume 58% of the median local household income ($67k/yr) (locally 1185% of renters already pay >50% of income on rent) — very limited rent-growth headroom before tenants either downsize or default.
Questions for listing agent
- It's been on market 55 days. Have you received any prior offers? Is the seller open to a 3% concession, seller financing, or rate buy-down credit?
- Built in 1970 — when were the roof, HVAC, electrical panel, plumbing, and water heater last replaced?
- Property tax is high relative to price — has the assessment been appealed recently, and will the sale trigger a re-assessment?
- Is there a deadline driving the sale (1031 exchange, divorce, estate, relocation)? That informs how much negotiation room exists.
- What's the average days-on-market for RENTAL listings here right now (not sales)? A rising rental-DOM trend means longer vacancies and softer asking-rent achievability than the comps imply.
- What's the recent tenant-quality profile in this submarket — average credit score on applications, eviction rate, late-payment / NSF rate, and stable-employment percentage? A property-management company in the area should have these aggregated.
- How much new for-sale + rental construction is in the pipeline within 1–3 miles? Heavy new supply typically softens prices + rents 12–24 months out; constrained supply supports both.
CashFlowRE · CFR-3VKQ1K7V0VSYJ8
· Data 12 h ago
cashflowre.app · 2026-05-29