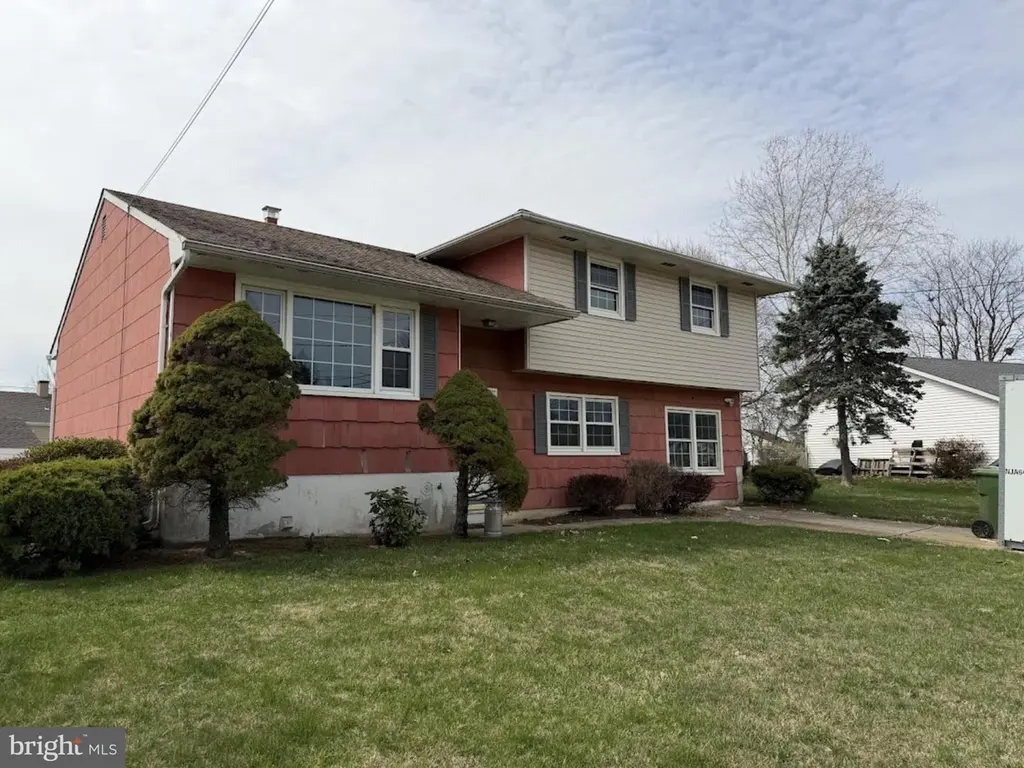
5 Clive Ct · The College of New Jersey, NJ
Flood risk 1/10 · Minimal
- FEMA flood zone
- X (unshaded)
- Chance of flooding over 30 yrs
- 0.0%
- Est. flood insurance / yr
- $507 – $1,088
Fire risk 1/10 · Minimal
- Est. fire insurance / yr
- $526 – $976
Heat risk 6/10 · Moderate
- Hot days now (above 101°F)
- 7 days/yr
- Hot days in 30 yrs
- 15 days/yr
Wind risk 6/10 · Moderate
- Chance of severe wind over 30 yrs
- 27.0%
Air-quality risk 4/10 · Minor
- Unhealthy air days now
- 4 days/yr
- Unhealthy air days in 30 yrs
- 5 days/yr
Risk factors via First Street. Map © Google.
Why this score? — see what drove the C grade
The composite is a weighted blend of 9 inputs, each scored 0–100. Each bar is that input's sub-score; the figure is the points it added to the 100-point composite (weight × sub-score).
- Cash flow +19.3/30.0
- ARV discount +15.0/15.0
- 1% rule +6.7/10.0
- DSCR +6.1/10.0
- Rent growth +3.3/5.0
- Schools +2.5/10.0
- Livability +2.5/5.0
- Condition / age +2.5/5.0
- Appreciation +0.0/10.0
$275,000
🖨 Deal sheet (PDF) 📄 Offer letter ✓ Due diligence
Listing remarks
####BEST AND FINAL OFFERS MUST BE IN BY 5/6/2026 BY 3:00PM##### Clive Ct is ready for your renovations! Property is a full renovation project and has been taken down to the studs and subflooring. No utilities are active (no electric, gas, or water). Property may contain hazardous conditions from demo work, including but not limited to weak flooring, tripping hazards, exposed nails, exposed wiring, debris, and uneven surfaces. ⚠️ ENTER AT YOUR OWN RISK. All parties entering must be 18+. Listing agent, seller, and Keller Williams Premier assume no liability for injury or damages. By entering, agents and their clients acknowledge and accept all risks. APPOINTMENT ONLY – DAYLIGHT HOURS
Key facts
- Built 1970
- Listed 55 days
Property features AI
Exterior
- Parking: Driveway
- Utilities: Public water; Public sewer; Power and utilities details not further specified
- Home design: Detached property; Above-grade finished living area reported (source: Assessor)
- Construction: Frame construction; Block foundation; Other structures both above and below grade
- Exterior features: Lot dimensions approximately 80 x 126; No tidal water
Interior
- Kitchen: Kitchen (appliances not specified)
- Bedrooms: Four bedrooms on the upper level
- Bathrooms: One full bathroom (upper level total); One half bathroom on the main level
- Heating & cooling: 90% forced air heating; Natural gas heating fuel; Central air conditioning (central A/C) with natural gas cooling fuel
- Interior features: Multiple living areas including a living room, den and recreation room; Partial basement; Two or more access exits
- Laundry & utility: Hot water: Natural gas
Neighborhood map
What this means for you Summary
Snapshot
- This is a 4-bed/1.5-bath single-family listed at $275k.
Deal economics
- At list price, monthly cash flow is $303 ($4k/yr) — positive.
- The deal already cash-flows at list — no discount required.
- Meets the 1% rule at list price ($3k rent vs $275k).
- Recommended offer: $267k (3.0% below list) — sets the bar for market timing.
- Cap rate 7.6% vs local median 3.6% in The College of New Jersey — top-decile yield for the area; either an underpriced asset or a hidden risk that comps aren't pricing in. Stress-test before assuming the spread holds.
Location & tenants
- Location reads: area grade C — affects rentability + tenant quality, not the cash-flow math above.
- Ewing Township School District (suburban): math 16% / reading 37% proficiency, ranked #358 of 472 in NJ (top 76%) — low school quality limits family demand, transient renter base, plan for 1-2y turnover.
- Zoned schools: William L Antheil Elementary School (math 13% / reading 23%, grade F, #1,049 of 1,303 statewide, top 81%, 692 students, 46% FRL); Gilmore J Fisher Middle School (math 17% / reading 39%, grade F, #335 of 431 statewide, top 79%, 791 students, 50% FRL); Ewing High School (math 21% / reading 46%, grade F, #251 of 399 statewide, top 64%, 1,109 students, 43% FRL).
- Market conditions: Rents rising (+3.3%/yr); 83 active listings in the ZIP; 7 comparable units currently listed for rent nearby; rentals at typical pace (median 16d on market — plan ~3-4 weeks tenant-placement turnaround); 2,256 units permitted in Mercer County in 2024 (1,303 in 5+ unit buildings).
- At $3,208/mo this rent would consume 58% of the median local household income ($67k/yr) (locally 1185% of renters already pay >50% of income on rent) — very limited rent-growth headroom before tenants either downsize or default.
Forward outlook
- Local home prices are declining (-3.0%/yr); year-one equity from $2k of loan paydown is wiped out by about $8k of value loss. Plan a longer hold.
- Mercer County population projected at +4% by 2050 — modest demand growth; plan on rents tracking national, not racing it.
Negotiation context
- It's been on market 55 days — a 3% lower offer ($267k) is reasonable based on typical stale-listing flexibility.
Risks & watch-outs
- Watch-outs: property tax is 2.9% of price.
- Climate carrying-cost: major wind risk, 27% chance of damaging wind over 30y; extreme-heat days projected 7→15/yr by 2055 (HVAC capex compounding) — expect insurance premiums to compound above CPI over the hold.
Questions for the listing agent
- It's been on market 55 days. Have you received any prior offers? Is the seller open to a 3% concession, seller financing, or rate buy-down credit?
- Built in 1970 — when were the roof, HVAC, electrical panel, plumbing, and water heater last replaced?
- Property tax is high relative to price — has the assessment been appealed recently, and will the sale trigger a re-assessment?
- Is there a deadline driving the sale (1031 exchange, divorce, estate, relocation)? That informs how much negotiation room exists.
- What's the average days-on-market for RENTAL listings here right now (not sales)? A rising rental-DOM trend means longer vacancies and softer asking-rent achievability than the comps imply.
- What's the recent tenant-quality profile in this submarket — average credit score on applications, eviction rate, late-payment / NSF rate, and stable-employment percentage? A property-management company in the area should have these aggregated.
- How much new for-sale + rental construction is in the pipeline within 1–3 miles? Heavy new supply typically softens prices + rents 12–24 months out; constrained supply supports both.
Investment metrics
- 1% rule
- 1.17% ✓
- Cap rate
- 7.62%
- Cash-on-cash
- 4.72%
- DSCR
- 1.21
- GRM
- 7.1
CMA / ARV
- ARV (on-the-fly)
- $478,368
- Comps found
- 12
Show comp detail 12 sales within ~0.75 mi
| Address | Dist | Beds/Ba | Sqft | Sold | Price | $/sf | Match |
|---|---|---|---|---|---|---|---|
| 4 David Dr | 0.32mi | 3/1.5 (-1) | 1,731 (+4%) | 2mo | $375,000 | $217 | 71 |
| 212 Nancy Ln | 0.30mi | 4/2.0 | 1,573 (-5%) | 11mo | $515,212 | $328 | 66 |
| 38 Running Brk | 0.41mi | 4/2.5 | 1,600 (-4%) | 6mo | $565,000 | $353 | 66 |
| 42 Running Brook Rd W | 0.38mi | 3/1.5 (-1) | 1,562 (-6%) | 2mo | $450,000 | $288 | 65 |
| 1 Beth Ann Way | 0.26mi | 3/2.0 (-1) | 1,820 (+10%) | 4mo | $450,000 | $247 | 62 |
| 52 Colleen Cir | 0.46mi | 3/1.5 (-1) | 1,769 (+6%) | 6mo | $475,000 | $269 | 58 |
| 4 Blossom Dr | 0.45mi | 4/2.5 | 1,824 (+10%) | 3mo | $540,000 | $296 | 56 |
| 71 Nancy Ln | 0.61mi | 4/1.5 | 1,771 (+7%) | 11mo | $461,000 | $260 | 51 |
| 9 Blossom Dr | 0.50mi | 4/2.5 | 1,861 (+12%) | 6mo | $535,000 | $287 | 48 |
| 10 Blossom Dr | 0.50mi | 4/2.5 | 1,861 (+12%) | 6mo | $550,000 | $296 | 48 |
| 74 Bunker Hill Rd | 0.72mi | 3/1.5 (-1) | 1,852 (+12%) | 9mo | $570,000 | $308 | 35 |
| 13 Lopatcong Dr | 0.75mi | 3/2.0 (-1) | 1,890 (+14%) | 5mo | $507,500 | $269 | 31 |
Match score weights: distance 35% · size 25% · config 20% · recency 20%. Top-matched comps best support the ARV.
Projected returns pro-forma
-3.0% appreciation · 3.31% rent growth · sell at horizon
- IRR
- -8.4%
- Equity multiple
- 0.69×
- Total profit
- $-24,001
- Equity at exit
- $41,003
- IRR
- 1.6%
- Equity multiple
- 1.12×
- Total profit
- $9,126
- Equity at exit
- $23,777
Cash invested: $77,000 (down + closing). Projections, not guarantees.
Landlord ↔ Tenant lean methodology
- Overall (STATE)
- 21 Tenant-Leaning
- State New Jersey
- 21 Tenant-Leaning · D+6
- County
- — inherits STATE
- City
- — inherits STATE
ZIP-level market 08638
- Rents YoY
- 3.3%
- Active inventory
- 83
- Price-to-rent
- 7.1×
Monthly cashflow live
- Estimated rent
- $3,208 high interval (Pro) →
- Mortgage (P&I)
- −$1,442
- Tax from tax record
- −$675 /mo · $8,098/yr
- Insurance
- −$115
- HOA
- −$0
- Vacancy / Maint / Mgmt
- −$674
- Net cashflow
- $303
Break-even live
Sensitivity live
| Price | -10% $459 | -5% $381 | +0% $303 | +5% $225 | +10% $147 |
|---|---|---|---|---|---|
| Rent | -10% $50 | -5% $176 | +0% $303 | +5% $430 | +10% $557 |
| Rate | -1.0pp $442 | -0.5pp $373 | base $303 | +0.5pp $232 | +1.0pp $159 |
UW: 25.0% down · 7.5% · 30yr · 1.5% tax · 5.0% vac · 8.0% maint · 8.0% mgmt
Financing live
Cash to close
- Down payment
- $68,750
- Closing costs
- $8,250
- Reserves months
- —
- Total cash needed
- —
Loan-product check · same deal, 3 products live
Conventional
25% down · 7.5% · 30yr
- Down + closing
- —
- Monthly P&I
- —
- Monthly cashflow
- —
- DSCR
- —
- Eligible?
- —
Personal DTI + credit; lowest rate.
DSCR
20% down · 8.5% · 30yr
- Down + closing
- —
- Monthly P&I
- —
- Monthly cashflow
- —
- DSCR
- —
- Eligible?
- —
No personal income docs; deal must DSCR.
Hard money
10% down · 12.0% · 12mo
- Down + closing
- —
- Monthly P&I
- —
- Monthly cashflow
- —
- DSCR
- —
- Eligible?
- —
Short-term bridge; refi at stabilization.
Rent comps 7 comps
| Address | Beds | Baths | Sqft | Rent | $/sqft | DOM | Units | Dist |
|---|---|---|---|---|---|---|---|---|
| 1000 Stewards Crossing Way Trenton, NJ | 1.0–3.0 | 1.0–2.0 | 973 | $3,193 | $3.28 | 15d | 10 | 0.62mi |
| 383 Johnson Ave Lawrenceville, NJ | 4.0 | 2.0 | 1605 | $3,200 | $1.99 | 15d | 1 | 0.68mi |
| 117 Browning Ave Ewing, NJ | 5.0 | 2.0 | 1584 | $3,500 | $2.21 | 22d | 1 | 0.90mi |
| 103 Pennsylvania Ave Ewing, NJ | 3.0 | 1.0 | 1200 | $2,600 | $2.17 | 15d | 1 | 1.17mi |
| 1698 Pennington Rd Unit 2ND FLR Ewing Township, NJ | 3.0 | 1.0 | 2211 | $1,900 | $0.86 | 22d | 1 | 1.20mi |
| 162 Shrewsbury Ct Pennington, NJ | 3.0 | 2.0 | 1826 | $3,150 | $1.73 | 45d | 1 | 1.29mi |
| 1008 Terrace Blvd Ewing, NJ | 4.0 | 1.0 | 1116 | $2,850 | $2.55 | 15d | 1 | 1.43mi |
Listing history 17 events
-
2026-06-22days on market $275,000 Active 55 DOM
-
2026-06-18days on market $275,000 Active 52 DOM
-
2026-06-17days on market $275,000 Active 51 DOM
-
2026-06-16days on market $275,000 Active 50 DOM
-
2026-06-15days on market $275,000 Active 49 DOM
-
2026-06-14days on market $275,000 Active 47 DOM
-
2026-06-13days on market $275,000 Active 46 DOM
-
2026-06-10days on market $275,000 Active 44 DOM
-
2026-06-09days on market $275,000 Active 43 DOM
-
2026-06-08days on market $275,000 Active 42 DOM
-
2026-06-07days on market $275,000 Active 41 DOM
-
2026-06-03days on market $275,000 Active 37 DOM
-
2026-06-02days on market $275,000 Active 36 DOM
-
2026-06-01days on market $275,000 Active 35 DOM
-
2026-05-31days on market $275,000 Active 34 DOM
-
2026-05-30days on market $275,000 Active 33 DOM
-
2026-04-27$275,000 Active
ⓘ Source: listings_history table (triggers on properties + properties_extension) + one-shot
backfill from property_details.listing_events for pre-trigger history.
Tax reassessment forecast NJ · Partial reset (capped growth)
- Current annual tax
- $8,098 · $675/mo
- Projected year-2 tax
- $8,098 · $675/mo
- Expected delta
- $0/yr ($0/mo · 0.0%)
ⓘ Screening estimate from a state-policy table — verify with the county assessor before closing.
Climate risk First Street
- Flood 1/10 Low FEMA zone X (unshaded) · 0% chance over 30 yrs
- Wildfire 1/10 Low
- Heat 6/10 Major 7 d/yr ≥101°F today · 15 d/yr by 30 yrs out
- Wind 6/10 Major 27% chance of damaging wind over 30 yrs
- Air quality 4/10 Moderate 4 unhealthy d/yr today · 5 by 30 yrs out
Nearby sold comps map
Loading sold comps map…
Walkable amenities ~0.75 mi
Loading nearby amenities…
Taxation est. · year 1
- Rental income
- $38,501
- − Mortgage interest
- −$15,404
- − Property taxes
- −$8,098
- − Insurance
- −$1,375
- − Repairs & maintenance
- −$3,080
- − Management
- −$3,080
- − Depreciation
- −$8,000
- Taxable loss
- −$536
- Est. tax savings @ 24.0%
- +$129
- After-tax cash flow
- $3,766/yr
For passive investors: Depreciation is non-cash, so a rental often shows a tax loss while cash-flowing — sheltering income. Rental losses are passive: they offset passive income freely, and up to $25,000/yr can offset ordinary (W-2) income if you actively participate and your MAGI is under $100k (phasing out to $0 by $150k); unused losses carry forward. On sale, claimed depreciation is recaptured at up to 25%, and gains may owe capital-gains tax (a 1031 exchange can defer both). Figures are a year-1 estimate at your 24.0% rate — not tax advice; consult a CPA.
Schools (NCES district)
- District
- Ewing Township School District
- NCES district ID
- 3404920
- Math proficiency
- 16% ▼ -17.00%
- Reading proficiency
- 37% ▼ -4.00%
- Median HH income
- $73,684
- Composite
- 25.48/100
- National rank
- #7443
- State rank
- #358 of 472 in NJ
Livability — The College of New Jersey
No livability data for this city. (Only ~50 U.S. cities are tracked.)
Census & demographics
- County
- Mercer County · 327,655 people
- Metro
- Trenton-Princeton, NJ
- Population (ZIP)
- 22,816
- Household income
- $66,875
- Rent vs Own
- Severe rent burden
- 1185.0
Population outlook (Mercer County) Hauer SSP2
- Today (2025)
- 381,395 people
- By 2030
- 384,640 · +0.9%
- By 2040
- 391,431 · +2.6%
- By 2050
- 397,845 · +4.3%
- By 2075
- 417,281 · +9.4%
- By 2100
- 420,327 · +10.2%
Race, ethnicity, and origin ACS 2023
- Neighborhood character
- Diverse neighborhood (Simpson 0.68)
- Race & ethnicity
- Black 43% White 31% Hispanic / Latino 21% Two or more races 8% Asian 2%
- Hispanic origin (detail)
- Mexican 2% Puerto Rican 6% Dominican 3%
- Common ancestry
- Romanian 4% Hispanic 2% Iranian 1%
- Foreign-born
- 24% · Canada, Guatemala, China
- Languages at home
- 76% English-only · Spanish 17% Russian/Polish/Slavic 2% Other Indo-European 2%
Political lean MEDSL · Mercer
- 2024 margin
- Solid D (+33.9) · D 65.9% · R 32.0% · Other 2.1%
- 2008→2024 swing
- -2.2pp toward R · 2008: 36.1pp · 2024: 33.9pp
- All cycles
- 2024: D+33.9 2020: D+40.0 2016: D+36.2 2012: D+36.8 2008: D+36.1
Not yet ingested
- Civics
- —
Market trends
- HPI YoY
- ▼ -286.00%
- Current HPI
- 334.5143
- Rent YoY
- ▲ 3.31%
- Metro
- Trenton-Princeton, NJ
- State GDP YoY
- ▲ 2.05%
- F500 in state
- 34
Industry mix (Fortune 500 HQ in NJ)
| Industry | F500 HQs | Revenue |
|---|---|---|
| Consumer Goods | 3 | $31B |
|
||
| Pharmaceuticals | 2 | $153B |
|
||
| Technology | 2 | $21B |
|
||
| Insurance | 2 | $20B |
|
||
| Healthcare | 2 | $19B |
|
||
| Financial Services | 1 | $70B |
|
||
Price history
1 event — show timeline
- 2026-04-27 Listed $275,000 BRIGHT MLS
Property tax history
+1.8%/yrLatest (2025): $8,098 · +3.0% YoY. Source: county tax records.
Cash-flow waterfall
monthlySold comps — $/sqft
last 12 mo · ≤1 miLoading sold comps…