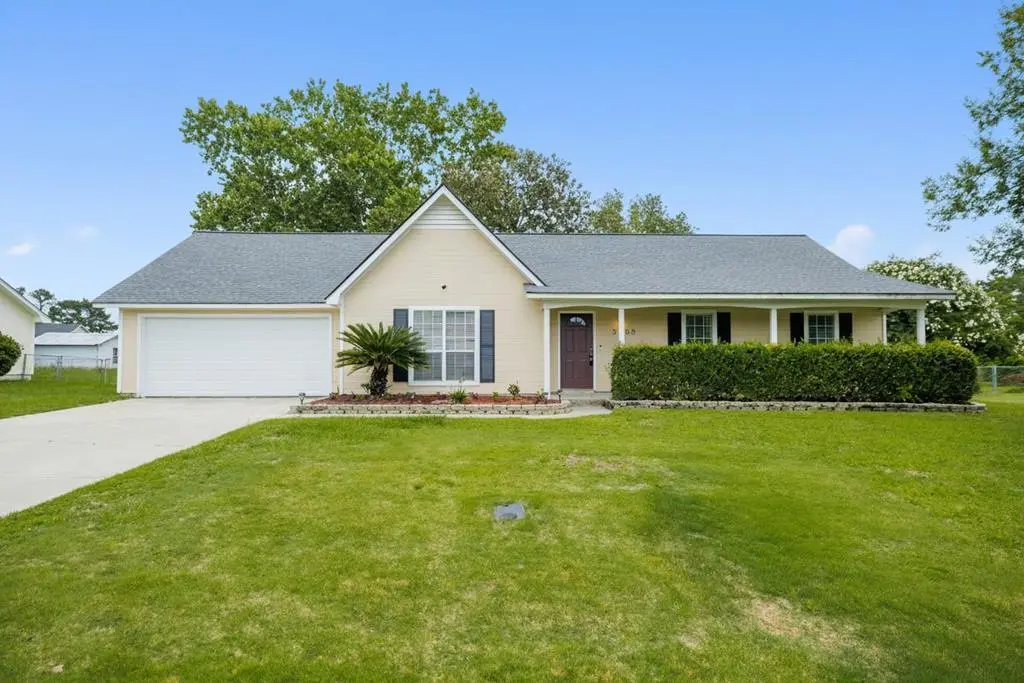
5068 Pearl Davis Rd
Bemiss, GA 31605
$229,900D
3 bd · 2.0 ba ·
1,628 sqft ·
Built 1993
· SingleFamily
· Pending
· 24 DOM
Cashflow @ list (25.0% down · 7.5%)
Estimated rent
$1,795/mo
Mortgage (P&I)
−$1,206
Tax + insurance
−$259
HOA
−$0
Vac / Maint / Mgmt
−$377
Net cashflow
$-46/mo
Annual
$-557/yr
Cap rate
6.05%
Cash-on-cash
-0.87%
DSCR
0.96
1% rule
0.78%
Cash to close
$64,372
Investor read
- This is a 3-bed/2.0-bath single-family listed at $230k.
- At list price, monthly cash flow is $-46 ($-557/yr) — negative.
- To cash-flow at today's rent, offer at most $222k (3.6% below list).
- To meet the 1% rule (rent ≥ 1% of price), the offer needs to be $180k (21.9% below list).
- It's been on market 24 days — a 2% lower offer ($226k) is reasonable based on typical stale-listing flexibility.
- Recommended offer: $180k (21.9% below list) — sets the bar for 1% rule.
- Local home prices are declining (-3.0%/yr); year-one equity from $2k of loan paydown is wiped out by about $7k of value loss. Plan a longer hold.
- Location reads: area grade D — affects rentability + tenant quality, not the cash-flow math above.
- Lowndes County (rural): math 59% / reading 52% proficiency, ranked #8 of 174 in GA (top 5%) — acceptable for families but not a draw, mixed tenant base, ~2y average lease.
- Zoned schools: Pine Grove Elementary School (math 62% / reading 54%, grade C+, #143 of 1,228 statewide, top 12%, 664 students, 56% FRL); Pine Grove Middle School (math 56% / reading 57%, grade B, #48 of 470 statewide, top 10%, 742 students, 50% FRL); Lowndes High School (math 69% / reading 51%, grade C+, #14 of 424 statewide, top 3%, 3,201 students, 39% FRL).
- Market conditions: Rents rising fast (+5.1%/yr); 232 active listings in the ZIP; 20 comparable units currently listed for rent nearby; rentals at typical pace (median 24d on market — plan ~3-4 weeks tenant-placement turnaround); solid renter incomes; 896 units permitted in Lowndes County in 2024 (0 in 5+ unit buildings).
- Lowndes County population projected at +10% by 2050 — modest demand growth; plan on rents tracking national, not racing it.
- 2 sale attempts since 5y ago with the ask held roughly flat each time — persistent listings suggest the price (not the market) is what's stuck; bring a comps-based counter.
- Current owner paid $180k; 28% above their basis — modest negotiation headroom, anchor on the comps not their cost.
- Climate carrying-cost: severe wind risk, 99% chance of damaging wind over 30y; extreme-heat days projected 7→20/yr by 2055 (HVAC capex compounding) — expect insurance premiums to compound above CPI over the hold.
- Cap rate 6.1% vs local median 4.7% in Bemiss — meaningfully above typical; check what's discounted (condition, days-on-market, listing class) to confirm the premium yield is real.
Questions for listing agent
- What do current leases actually rent for vs. the listed asking? Can we see a recent rent roll and the last 12 months of T-12 income?
- Is there a deadline driving the sale (1031 exchange, divorce, estate, relocation)? That informs how much negotiation room exists.
- The area grade is low — what's the realistic commute time and amenity access for the typical tenant pool here? Any planned neighborhood developments (good or bad) we should know about?
- What's the average days-on-market for RENTAL listings here right now (not sales)? A rising rental-DOM trend means longer vacancies and softer asking-rent achievability than the comps imply.
- What's the recent tenant-quality profile in this submarket — average credit score on applications, eviction rate, late-payment / NSF rate, and stable-employment percentage? A property-management company in the area should have these aggregated.
- How much new for-sale + rental construction is in the pipeline within 1–3 miles? Heavy new supply typically softens prices + rents 12–24 months out; constrained supply supports both.
CashFlowRE · CFR-3WT4EGA5T9WCNE
· Data 3 h ago
cashflowre.app · 2026-05-29