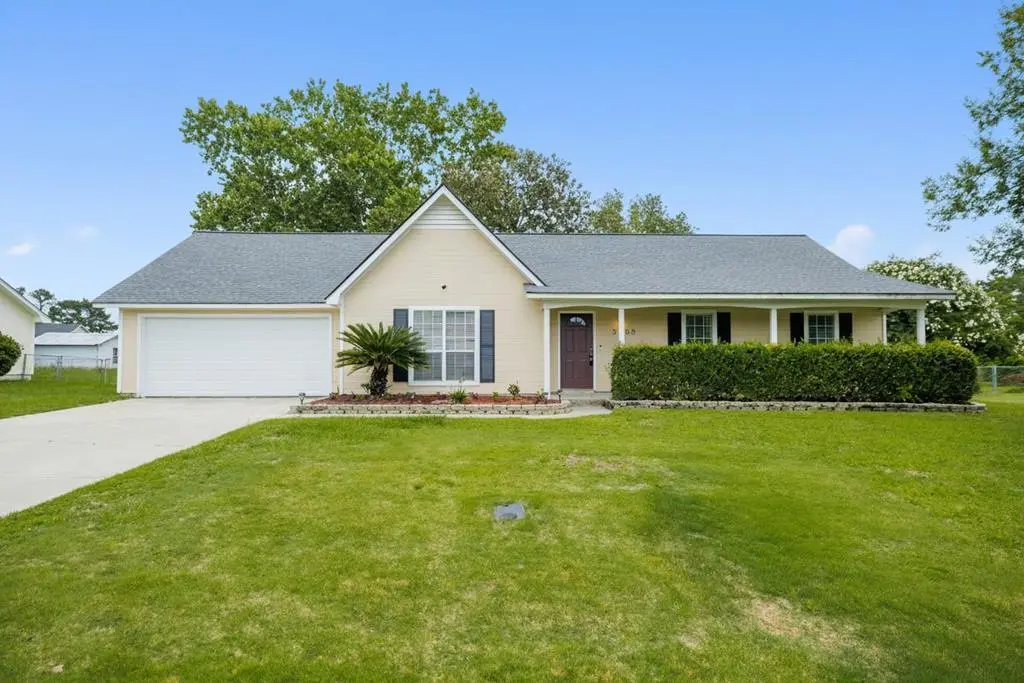
5068 Pearl Davis Rd · Bemiss, GA
Flood risk 1/10 · Minimal
- FEMA flood zone
- X (unshaded)
- Chance of flooding over 30 yrs
- 0.0%
- Est. flood insurance / yr
- $507 – $1,088
Fire risk 4/10 · Minor
- Est. fire insurance / yr
- $963 – $1,789
Heat risk 8/10 · Major
- Hot days now (above 107°F)
- 7 days/yr
- Hot days in 30 yrs
- 20 days/yr
Wind risk 8/10 · Major
- Chance of severe wind over 30 yrs
- 99.0%
Air-quality risk 6/10 · Moderate
- Unhealthy air days now
- 12 days/yr
- Unhealthy air days in 30 yrs
- 14 days/yr
Risk factors via First Street. Map © Google.
Why this score? — see what drove the D grade
The composite is a weighted blend of 9 inputs, each scored 0–100. Each bar is that input's sub-score; the figure is the points it added to the 100-point composite (weight × sub-score).
- Cash flow +12.2/30.0
- ARV discount +9.9/15.0
- Schools +4.7/10.0
- Rent growth +3.8/5.0
- DSCR +3.6/10.0
- 1% rule +2.8/10.0
- Livability +2.5/5.0
- Condition / age +2.5/5.0
- Appreciation +0.0/10.0
$229,900
🖨 Deal sheet (PDF) 📄 Offer letter ✓ Due diligence
Listing remarks MLS
Beautiful 3 Bedroom 2 Bath home with Tile flooring throughout except for the bedrooms. Large living room with Vaulted ceiling and stone fireplace. Kitchen has plenty of cabinet and counter space, pantry and an eat in breakfast area. Huge laundry room with tons of room with separate entry from the garage and access to the backyard. Large Master suite with custom built shelving in the closet and double sinks! Guest bedrooms are perfect size for kids or your guests. Best of all if you want to be your kids hero this is the house for you! Backyard has a Custom two story tree house and zip line!! Fenced backyard with additional storage shed for your lawn equipment and also includes transferable termite bond! Just minutes from Moody Air Force Base, shopping and entertainment! Call today
Key facts
- Vaulted ceiling
- Stone fireplace
- Fenced backyard
Tags
Property features AI
Finance
- Other: Zoning: R-10
- Financial info: No additional financial details provided
- HOA & community: No HOA details provided
Exterior
- Parking: 2-car garage
- Security: No security details provided
- Utilities: Private well water; Septic tank sewage
- Home design: Single-family residence; One-story
- Construction: Masonite exterior; Shingle roof
- Exterior features: Fenced yard; Covered patio/porch
Interior
- Kitchen: Dishwasher; Microwave; Refrigerator
- Bedrooms: No specific bedroom details provided
- Flooring: No flooring details provided
- Bathrooms: 2 full bathrooms
- Heating & cooling: No heating or cooling details provided
- Interior features: Dishwasher; Microwave; Refrigerator; Covered patio/porch
- Laundry & utility: Dedicated laundry room
Neighborhood map
What this means for you Summary
Snapshot
- This is a 3-bed/2.0-bath single-family listed at $230k.
Deal economics
- At list price, monthly cash flow is $-46 ($-557/yr) — negative.
- To cash-flow at today's rent, offer at most $222k (3.6% below list).
- To meet the 1% rule (rent ≥ 1% of price), the offer needs to be $180k (21.9% below list).
- Recommended offer: $180k (21.9% below list) — sets the bar for 1% rule.
- Cap rate 6.1% vs local median 4.7% in Bemiss — meaningfully above typical; check what's discounted (condition, days-on-market, listing class) to confirm the premium yield is real.
Location & tenants
- Location reads: area grade D — affects rentability + tenant quality, not the cash-flow math above.
- Lowndes County (rural): math 59% / reading 52% proficiency, ranked #8 of 174 in GA (top 5%) — acceptable for families but not a draw, mixed tenant base, ~2y average lease.
- Zoned schools: Pine Grove Elementary School (math 62% / reading 54%, grade C+, #143 of 1,228 statewide, top 12%, 664 students, 56% FRL); Pine Grove Middle School (math 56% / reading 57%, grade B, #48 of 470 statewide, top 10%, 742 students, 50% FRL); Lowndes High School (math 69% / reading 51%, grade C+, #14 of 424 statewide, top 3%, 3,201 students, 39% FRL).
- Market conditions: Rents rising fast (+5.1%/yr); 233 active listings in the ZIP; 20 comparable units currently listed for rent nearby; rentals at typical pace (median 23d on market — plan ~3-4 weeks tenant-placement turnaround); solid renter incomes; 896 units permitted in Lowndes County in 2024 (0 in 5+ unit buildings).
Forward outlook
- Local home prices are declining (-3.0%/yr); year-one equity from $2k of loan paydown is wiped out by about $7k of value loss. Plan a longer hold.
- Lowndes County population projected at +10% by 2050 — modest demand growth; plan on rents tracking national, not racing it.
Negotiation context
- It's been on market 23 days — a 2% lower offer ($226k) is reasonable based on typical stale-listing flexibility.
- 2 sale attempts since 5y ago with the ask held roughly flat each time — persistent listings suggest the price (not the market) is what's stuck; bring a comps-based counter.
- Current owner paid $180k; 28% above their basis — modest negotiation headroom, anchor on the comps not their cost.
Risks & watch-outs
- Climate carrying-cost: severe wind risk, 99% chance of damaging wind over 30y; extreme-heat days projected 7→20/yr by 2055 (HVAC capex compounding) — expect insurance premiums to compound above CPI over the hold.
Questions for the listing agent
- What do current leases actually rent for vs. the listed asking? Can we see a recent rent roll and the last 12 months of T-12 income?
- Is there a deadline driving the sale (1031 exchange, divorce, estate, relocation)? That informs how much negotiation room exists.
- The area grade is low — what's the realistic commute time and amenity access for the typical tenant pool here? Any planned neighborhood developments (good or bad) we should know about?
- What's the average days-on-market for RENTAL listings here right now (not sales)? A rising rental-DOM trend means longer vacancies and softer asking-rent achievability than the comps imply.
- What's the recent tenant-quality profile in this submarket — average credit score on applications, eviction rate, late-payment / NSF rate, and stable-employment percentage? A property-management company in the area should have these aggregated.
- How much new for-sale + rental construction is in the pipeline within 1–3 miles? Heavy new supply typically softens prices + rents 12–24 months out; constrained supply supports both.
Investment metrics
- 1% rule
- 0.78% ✗
- Cap rate
- 6.05%
- Cash-on-cash
- -0.87%
- DSCR
- 0.96
- GRM
- 10.7
CMA / ARV
- ARV (on-the-fly)
- $242,572
- Comps found
- 12
Show comp detail 12 sales within ~0.75 mi
| Address | Dist | Beds/Ba | Sqft | Sold | Price | $/sf | Match |
|---|---|---|---|---|---|---|---|
| 5210 N Northridge Rd | 0.27mi | 3/2.0 | 1,556 (-4%) | 2mo | $219,500 | $141 | 78 |
| 4221 Buckhead Dr | 0.23mi | 4/2.0 (+1) | 1,562 (-4%) | 0mo | $250,000 | $160 | 77 |
| 5209 N Northridge Rd | 0.24mi | 3/2.0 | 1,541 (-5%) | 4mo | $229,000 | $149 | 76 |
| 5211 Bobcat Cir | 0.19mi | 4/2.0 (+1) | 1,607 (-1%) | 13mo | $237,000 | $147 | 73 |
| 4192 Bowen Way | 0.36mi | 4/2.0 (+1) | 1,689 (+4%) | 1mo | $295,000 | $175 | 71 |
| 4014 Sandy Run Dr | 0.44mi | 3/2.0 | 1,580 (-3%) | 8mo | $215,000 | $136 | 68 |
| 4186 Bowen Way | 0.36mi | 4/2.0 (+1) | 1,619 (-1%) | 12mo | $289,150 | $179 | 67 |
| 4174 Bowen Way | 0.37mi | 4/2.0 (+1) | 1,613 (-1%) | 13mo | $279,000 | $173 | 65 |
| 5214 Bobcat Cir | 0.15mi | 4/2.0 (+1) | 1,761 (+8%) | 14mo | $230,900 | $131 | 62 |
| 3804 Cross Creek Trl | 0.73mi | 3/2.0 | 1,554 (-4%) | 11mo | $228,500 | $147 | 49 |
| 3955 Cobblestone Way | 0.63mi | 4/2.0 (+1) | 1,523 (-6%) | 7mo | $238,000 | $156 | 49 |
| 4832 Lori St | 0.60mi | 3/2.0 | 1,871 (+15%) | 14mo | $250,000 | $134 | 36 |
Match score weights: distance 35% · size 25% · config 20% · recency 20%. Top-matched comps best support the ARV.
Projected returns pro-forma
-3.0% appreciation · 5.07% rent growth · sell at horizon
- IRR
- -15.6%
- Equity multiple
- 0.43×
- Total profit
- $-36,446
- Equity at exit
- $34,279
- IRR
- -4.2%
- Equity multiple
- 0.70×
- Total profit
- $-19,412
- Equity at exit
- $19,878
Cash invested: $64,372 (down + closing). Projections, not guarantees.
Landlord ↔ Tenant lean methodology
- Overall (STATE)
- 90 Strongly Landlord-Friendly
- State Georgia
- 90 Strongly Landlord-Friendly · R+3
- County
- — inherits STATE
- City
- — inherits STATE
ZIP-level market 31605
- Home prices YoY
- -11.5%
- Rents YoY
- 5.1%
- Active inventory
- 233
- Price-to-rent
- 10.7×
Monthly cashflow live
- Estimated rent
- $1,795 high interval (Pro) →
- Mortgage (P&I)
- −$1,206
- Tax from tax record
- −$163 /mo · $1,957/yr
- Insurance
- −$96
- HOA
- −$0
- Lot rent
- −$0
- Vacancy / Maint / Mgmt
- −$377
- Net cashflow
- $-46
Break-even live
Sensitivity live
| Price | -10% $84 | -5% $19 | +0% $-46 | +5% $-112 | +10% $-177 |
|---|---|---|---|---|---|
| Rent | -10% $-188 | -5% $-117 | +0% $-46 | +5% $24 | +10% $95 |
| Rate | -1.0pp $69 | -0.5pp $12 | base $-46 | +0.5pp $-106 | +1.0pp $-167 |
UW: 25.0% down · 7.5% · 30yr · 1.5% tax · 5.0% vac · 8.0% maint · 8.0% mgmt
Financing live
Cash to close
- Down payment
- $57,475
- Closing costs
- $6,897
- Reserves months
- —
- Total cash needed
- —
Loan-product check · same deal, 3 products live
Conventional
25% down · 7.5% · 30yr
- Down + closing
- —
- Monthly P&I
- —
- Monthly cashflow
- —
- DSCR
- —
- Eligible?
- —
Personal DTI + credit; lowest rate.
DSCR
20% down · 8.5% · 30yr
- Down + closing
- —
- Monthly P&I
- —
- Monthly cashflow
- —
- DSCR
- —
- Eligible?
- —
No personal income docs; deal must DSCR.
Hard money
10% down · 12.0% · 12mo
- Down + closing
- —
- Monthly P&I
- —
- Monthly cashflow
- —
- DSCR
- —
- Eligible?
- —
Short-term bridge; refi at stabilization.
Rent comps 20 comps
| Address | Beds | Baths | Sqft | Rent | $/sqft | DOM | Units | Dist |
|---|---|---|---|---|---|---|---|---|
| 5124 Northridge Rd S Valdosta, GA | 3.0 | 2.0 | 1454 | $1,700 | $1.17 | 23d | 1 | 0.15mi |
| 5026 Pearl Davis Rd Valdosta, GA | 3.0 | 2.0 | 1207 | $1,200 | $0.99 | 23d | 1 | 0.19mi |
| 6023 Bemiss Towns Dr Valdosta, GA | 3.0 | 2.5 | 1498 | $1,550 | $1.03 | 23d | 1 | 0.48mi |
| 6042 Bemiss Towns Dr Valdosta, GA | 3.0 | 2.0 | 1537 | $1,700 | $1.11 | 23d | 1 | 0.48mi |
| 4141 Pebble Creek Dr Valdosta, GA | 3.0 | 2.0 | 1189 | $1,295 | $1.09 | 23d | 1 | 0.61mi |
| 4007 Foxridge Ln Valdosta, GA | 4.0 | 2.0 | 1450 | $1,750 | $1.21 | 23d | 1 | 0.63mi |
| 3912 Duke Ct Valdosta, GA | 4.0 | 2.0 | 1850 | $2,000 | $1.08 | 23d | 1 | 0.76mi |
| 4001 Conway Cir Valdosta, GA | 3.0 | 2.0 | 1797 | $2,000 | $1.11 | 23d | 1 | 0.77mi |
| 4120 Clay Dr Valdosta, GA | 4.0 | 2.0 | 1806 | $2,000 | $1.11 | 23d | 1 | 0.79mi |
| 3908 Countess Ct Valdosta, GA | 4.0 | 2.0 | 1917 | $2,250 | $1.17 | 46d | 1 | 0.86mi |
| 4125 Barrington Dr Valdosta, GA | 3.0 | 2.0 | 1212 | $1,500 | $1.24 | 46d | 1 | 1.00mi |
| 3964 Crusader Ct Valdosta, GA | 4.0 | 2.0 | 1851 | $2,400 | $1.30 | 23d | 1 | 1.01mi |
| 4032 Case Pt Valdosta, GA | 4.0 | 2.0 | 1664 | $2,050 | $1.23 | 23d | 1 | 1.06mi |
| 4051 Gramercy Dr Valdosta, GA | 4.0 | 2.5 | 1771 | $2,300 | $1.30 | 23d | 1 | 1.14mi |
| 3925 Glen Laurel Dr S Valdosta, GA | 3.0 | 2.0 | 1510 | $1,850 | $1.23 | 23d | 1 | 1.20mi |
| 3919 Stratford Cir Valdosta, GA | 4.0 | 2.0 | 2024 | $1,900 | $0.94 | 46d | 1 | 1.22mi |
| 4782 Stonewall Cir Valdosta, GA | 3.0 | 2.0 | 1349 | $1,550 | $1.15 | 46d | 1 | 1.22mi |
| 3875 Trotters Ridge Cir Valdosta, GA | 3.0 | 2.0 | 1292 | $1,700 | $1.32 | 23d | 1 | 1.38mi |
| 3824 Brookfield Dr Valdosta, GA | 3.0 | 2.0 | 1517 | $2,000 | $1.32 | 23d | 1 | 1.43mi |
| 3844 Coventry Dr Valdosta, GA | 4.0 | 2.0 | 1765 | $1,950 | $1.10 | 23d | 1 | 1.46mi |
Listing history 23 events
-
2026-06-21days on market $229,900 Active 23 DOM
-
2026-06-19days on market $229,900 Active 21 DOM
-
2026-06-18days on market $229,900 Active 20 DOM
-
2026-06-17days on market $229,900 Active 19 DOM
-
2026-06-16days on market $229,900 Active 18 DOM
-
2026-06-15days on market $229,900 Active 17 DOM
-
2026-06-14days on market $229,900 Active 15 DOM
-
2026-06-13days on market $229,900 Active 14 DOM
-
2026-06-10days on market $229,900 Active 12 DOM
-
2026-06-09days on market $229,900 Active 11 DOM
-
2026-06-08days on market $229,900 Active 10 DOM
-
2026-06-07days on market $229,900 Active 9 DOM
-
2026-06-05days on market $229,900 Active 6 DOM
-
2026-06-03days on market $229,900 Active 5 DOM
-
2026-06-02days on market $229,900 Active 4 DOM
-
2026-06-01days on market $229,900 Active 3 DOM
-
2026-05-31days on market $229,900 Active 2 DOM
-
2026-05-29$229,900 Active
-
2021-12-13soldstatus $180,000
-
2021-12-06soldstatus $180,000 795-char remark
Show marketing remark (795 chars)
Beautiful 3 Bedroom 2 Bath home with Tile flooring throughout except for the bedrooms. Large living room with Vaulted ceiling and stone fireplace. Kitchen has plenty of cabinet and counter space, pantry and an eat in breakfast area. Huge laundry room with tons of room with separate entry from the garage and access to the backyard. Large Master suite with custom built shelving in the closet and double sinks! Guest bedrooms are perfect size for kids or your guests. Best of all if you want to be your kids hero this is the house for you! Backyard has a Custom two story tree house and zip line!! Fenced backyard with additional storage shed for your lawn equipment and also includes transferable termite bond! Just minutes from Moody Air Force Base, shopping and entertainment! Call today
-
2021-10-21$169,900 795-char remark
Show marketing remark (795 chars)
Beautiful 3 Bedroom 2 Bath home with Tile flooring throughout except for the bedrooms. Large living room with Vaulted ceiling and stone fireplace. Kitchen has plenty of cabinet and counter space, pantry and an eat in breakfast area. Huge laundry room with tons of room with separate entry from the garage and access to the backyard. Large Master suite with custom built shelving in the closet and double sinks! Guest bedrooms are perfect size for kids or your guests. Best of all if you want to be your kids hero this is the house for you! Backyard has a Custom two story tree house and zip line!! Fenced backyard with additional storage shed for your lawn equipment and also includes transferable termite bond! Just minutes from Moody Air Force Base, shopping and entertainment! Call today
-
2006-06-11soldstatus $127,000
-
1993-07-09soldstatus $79,900
ⓘ Source: listings_history table (triggers on properties + properties_extension) + one-shot
backfill from property_details.listing_events for pre-trigger history.
Tax reassessment forecast GA · Resets to sale price
- Current annual tax
- $1,957 · $163/mo
- Projected year-2 tax
- $2,115 · $176/mo
- Expected delta
- +$158/yr (+$13/mo · 8.1%)
ⓘ Screening estimate from a state-policy table — verify with the county assessor before closing.
Climate risk First Street
- Flood 1/10 Low FEMA zone X (unshaded) · 0% chance over 30 yrs
- Wildfire 4/10 Moderate
- Heat 8/10 Severe 7 d/yr ≥107°F today · 20 d/yr by 30 yrs out
- Wind 8/10 Severe 99% chance of damaging wind over 30 yrs
- Air quality 6/10 Major 12 unhealthy d/yr today · 14 by 30 yrs out
Nearby sold comps map
Loading sold comps map…
Walkable amenities ~0.75 mi
Loading nearby amenities…
Taxation est. · year 1
- Rental income
- $21,540
- − Mortgage interest
- −$12,878
- − Property taxes
- −$1,957
- − Insurance
- −$1,150
- − Repairs & maintenance
- −$1,723
- − Management
- −$1,723
- − Depreciation
- −$6,688
- Taxable loss
- −$4,579
- Est. tax savings @ 24.0%
- +$1,099
- After-tax cash flow
- $542/yr
For passive investors: Depreciation is non-cash, so a rental often shows a tax loss while cash-flowing — sheltering income. Rental losses are passive: they offset passive income freely, and up to $25,000/yr can offset ordinary (W-2) income if you actively participate and your MAGI is under $100k (phasing out to $0 by $150k); unused losses carry forward. On sale, claimed depreciation is recaptured at up to 25%, and gains may owe capital-gains tax (a 1031 exchange can defer both). Figures are a year-1 estimate at your 24.0% rate — not tax advice; consult a CPA.
Schools (NCES district)
- District
- Lowndes County
- NCES district ID
- 1303390
- Math proficiency
- 59% ▼ -1.00%
- Reading proficiency
- 52% ▼ -2.00%
- Median HH income
- $48,221
- Composite
- 47.21/100
- National rank
- #2317
- State rank
- #8 of 174 in GA
Livability — Bemiss
No livability data for this city. (Only ~50 U.S. cities are tracked.)
Census & demographics
- Census place
- Bemiss, GA
- County
- Lowndes County · 107,801 people
- City population
- 24,280
- Metro
- Valdosta, GA
- Population (ZIP)
- 24,829
- Household income
- $79,156
- Rent vs Own
- Severe rent burden
- 642.0
Population outlook (Lowndes County) Hauer SSP2
- Today (2025)
- 120,348 people
- By 2030
- 123,469 · +2.6%
- By 2040
- 128,482 · +6.8%
- By 2050
- 131,907 · +9.6%
- By 2075
- 139,080 · +15.6%
- By 2100
- 133,649 · +11.1%
Race, ethnicity, and origin ACS 2023
- Neighborhood character
- Diverse neighborhood (Simpson 0.58)
- Race & ethnicity
- White 58% Black 27% Two or more races 7% Hispanic / Latino 7% Asian 2%
- Hispanic origin (detail)
- Mexican 3% Puerto Rican 3%
- Common ancestry
- Italian 2% Slovak 2% Lithuanian 2%
- Foreign-born
- 4% · Canada, South Korea, Vietnam
- Languages at home
- 93% English-only · Spanish 3% German/W. Germanic 1%
Political lean MEDSL · Lowndes
- 2024 margin
- R (+18.0) · D 40.8% · R 58.8%
- 2008→2024 swing
- -8.6pp toward R · 2008: -9.4pp · 2024: -18.0pp
- All cycles
- 2024: R+18.0 2020: R+12.0 2016: R+18.2 2012: R+10.5 2008: R+9.4
Not yet ingested
- Civics
- —
Market trends
- HPI YoY
- ▼ -24.74%
- Current HPI
- 189.8471
- Rent YoY
- ▲ 5.07%
- Metro
- Valdosta, GA
- State GDP YoY
- ▲ 2.66%
- F500 in state
- 28
Industry mix (Fortune 500 HQ in GA)
| Industry | F500 HQs | Revenue |
|---|---|---|
| Paper / Packaging | 2 | $29B |
|
||
| Retail | 1 | $160B |
|
||
| Transportation / Logistics | 1 | $91B |
|
||
| Airlines | 1 | $62B |
|
||
| Consumer Goods | 1 | $47B |
|
||
| Utilities | 1 | $25B |
|
||
Price history
+187.7% since first listed6 events — show timeline
- 2026-05-29 Listed $229,900 SGMLS
- 2021-12-13 Sold (Public Records) $180,000 Public Records
- 2021-12-06 Sold (MLS) $180,000 SGMLS
- 2021-10-21 Listed $169,900 SGMLS
- 2006-06-11 Sold (Public Records) $127,000 Public Records
- 1993-07-09 Sold (Public Records) $79,900 Public Records
Property tax history
+3.4%/yrLatest (2025): $1,957 · -1.6% YoY. Source: county tax records.
Cash-flow waterfall
monthlySold comps — $/sqft
last 12 mo · ≤1 miLoading sold comps…