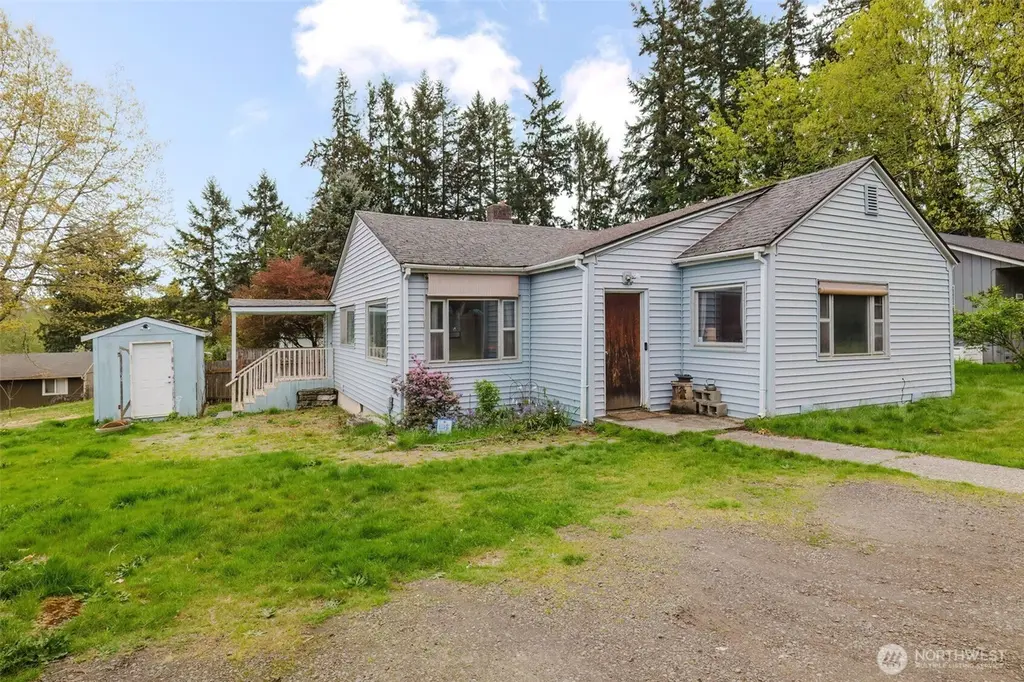
114 Kendall St
Port Orchard, WA 98366
$305,000D
3 bd · 1.0 ba ·
970 sqft ·
Built 1949
· SingleFamily
· Active
· 49 DOM
Cashflow @ list (25.0% down · 7.5%)
Estimated rent
$2,158/mo
Mortgage (P&I)
−$1,599
Tax + insurance
−$346
HOA
−$0
Vac / Maint / Mgmt
−$453
Net cashflow
$-241/mo
Annual
$-2,890/yr
Cap rate
5.35%
Cash-on-cash
-3.38%
DSCR
0.85
1% rule
0.71%
Cash to close
$85,400
Investor read
- This is a 3-bed/1.0-bath single-family listed at $305k.
- At list price, monthly cash flow is $-241 ($-3k/yr) — negative.
- To cash-flow at today's rent, offer at most $262k (13.9% below list).
- To meet the 1% rule (rent ≥ 1% of price), the offer needs to be $216k (29.2% below list).
- It's been on market 49 days — a 3% lower offer ($296k) is reasonable based on typical stale-listing flexibility.
- Recommended offer: $216k (29.2% below list) — sets the bar for 1% rule.
- Local home prices are declining (-3.0%/yr); year-one equity from $2k of loan paydown is wiped out by about $9k of value loss. Plan a longer hold.
- Location reads 79/100 on livability (#110 in WA, #2,167 nationally) — a middle-class / working-renter tenant base. Strengths: amenities A+, employment A+, housing A+; Watch: crime D-, commute F, cost of living F.
- South Kitsap School District (suburban): math 52% / reading 64% proficiency, ranked #71 of 291 in WA (top 24%) — acceptable for families but not a draw, mixed tenant base, ~2y average lease.
- Watch-outs: built in 1949 — expect roof / HVAC / electrical / plumbing capex.
- Market conditions: Rents flat; 251 active listings in the ZIP; 10 comparable units currently listed for rent nearby; rentals at typical pace (median 22d on market — plan ~3-4 weeks tenant-placement turnaround); solid renter incomes; 1,294 units permitted in Kitsap County in 2024 (302 in 5+ unit buildings).
- Kitsap County population projected at +8% by 2050 — modest demand growth; plan on rents tracking national, not racing it.
- 3 sale attempts since 5y ago with the ask held roughly flat each time — persistent listings suggest the price (not the market) is what's stuck; bring a comps-based counter.
- Cap rate 5.3% vs local median 3.0% in Port Orchard — top-decile yield for the area; either an underpriced asset or a hidden risk that comps aren't pricing in. Stress-test before assuming the spread holds.
Questions for listing agent
- What do current leases actually rent for vs. the listed asking? Can we see a recent rent roll and the last 12 months of T-12 income?
- It's been on market 49 days. Have you received any prior offers? Is the seller open to a 29% concession, seller financing, or rate buy-down credit?
- Built in 1949 — when were the roof, HVAC, electrical panel, plumbing, and water heater last replaced?
- Is there a deadline driving the sale (1031 exchange, divorce, estate, relocation)? That informs how much negotiation room exists.
- Schools are A-rated — typically a magnet for longer-tenancy family renters. What's the average tenant stay here, and is there a school-zone premium baked into asking?
- Crime grade is D in this area — have there been break-ins, vandalism, or insurance claims at this property in the last 3 years? What carrier currently insures it and at what premium?
- The area grade is low — what's the realistic commute time and amenity access for the typical tenant pool here? Any planned neighborhood developments (good or bad) we should know about?
- What's the average days-on-market for RENTAL listings here right now (not sales)? A rising rental-DOM trend means longer vacancies and softer asking-rent achievability than the comps imply.
CashFlowRE · CFR-3Z2CKH715W2TG4
· Data 2 days ago
cashflowre.app · 2026-05-29