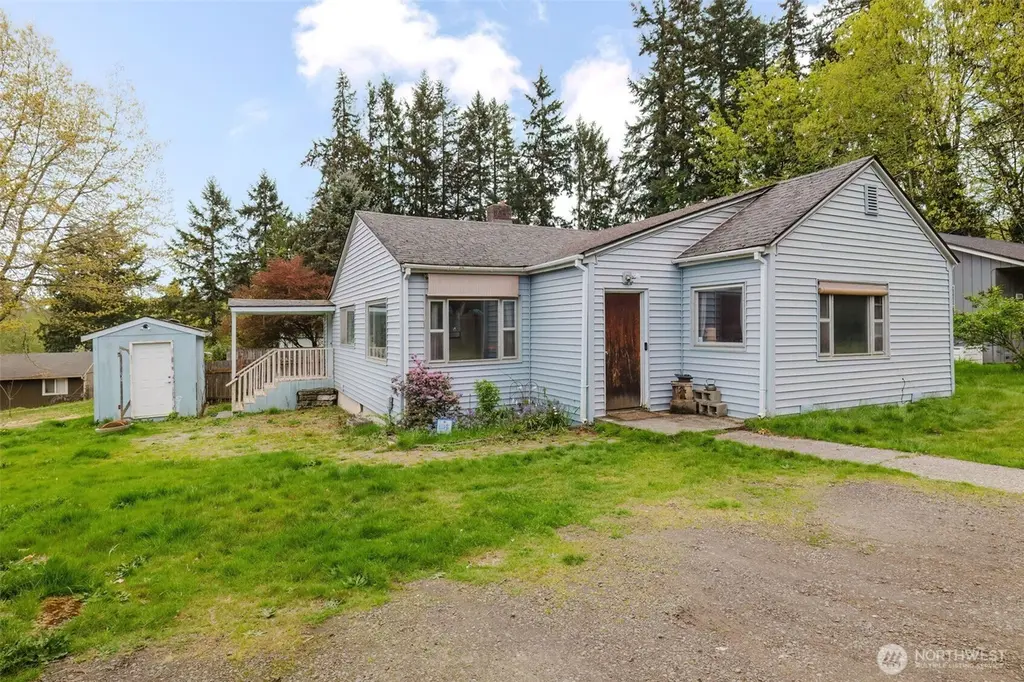
114 Kendall St · Port Orchard, WA
Flood risk 1/10 · Minimal
- FEMA flood zone
- X (unshaded)
- Chance of flooding over 30 yrs
- 0.0%
- Est. flood insurance / yr
- $507 – $1,088
Fire risk 1/10 · Minimal
- Est. fire insurance / yr
- $604 – $1,122
Heat risk 3/10 · Minor
- Hot days now (above 86°F)
- 7 days/yr
- Hot days in 30 yrs
- 14 days/yr
Wind risk 1/10 · Minimal
- Chance of severe wind over 30 yrs
- —
Air-quality risk 7/10 · Major
- Unhealthy air days now
- 9 days/yr
- Unhealthy air days in 30 yrs
- 10 days/yr
Risk factors via First Street. Map © Google.
Why this score? — see what drove the D grade
The composite is a weighted blend of 9 inputs, each scored 0–100. Each bar is that input's sub-score; the figure is the points it added to the 100-point composite (weight × sub-score).
- ARV discount +14.1/15.0
- Cash flow +9.0/30.0
- Schools +5.2/10.0
- Livability +4.0/5.0
- Rent growth +2.6/5.0
- DSCR +2.5/10.0
- Condition / age +2.5/5.0
- 1% rule +2.1/10.0
- Appreciation +0.0/10.0
$305,000
🖨 Deal sheet 📄 Offer letter ✓ Due diligence
Listing remarks
Endless potential with this charming rambler that has partial water views. Great location, situated on a shy quarter acre lot, close to the Port Orchard waterfront with restaurants and shops to explore. Inside you'll find three bedrooms, full bath, nice size living room with water view, kitchen with eat in area and spacious laundry/mud room. Vinyl siding for easy maintenance, finished outbuilding with power would be great shop or bonus room, surrounded by mature trees and flower beds to bring back to their full beauty.
Key facts
- Partial water views
- Flower beds
- Shy quarter acre lot
Tags
Property features AI
Finance
- Other: Assessor-sourced square footage (living area 970); Living area reported as 970; Property assessed with public utilities and local service providers
- Financial info: Listing terms: Cash or Conventional
Exterior
- Parking: Detached carport (1 covered/carport space)
- Utilities: Public water; Sewer connected; Power by PSE; Cable (Astound) connected; Internet (Astound) connected
- Home design: Single-family residence; One-story house with main-level entry; Built on lot
- Construction: Metal/vinyl construction materials; Composition roof; Poured concrete foundation; Built with electric and oil energy sources
- Exterior features: Metal/vinyl exterior; Corner lot on a dead-end street; Dirt and paved access; Level topography; Has a view
Interior
- Kitchen: Kitchen with eating space; Refrigerator; Stove/Range
- Bedrooms: Three bedrooms, all on the main level (including a primary bedroom)
- Flooring: Hardwood; Vinyl; Carpet
- Bathrooms: One full bathroom on the main level
- Heating & cooling: Forced air heating; No central cooling
- Interior features: Entry hall; Living room; Utility room; Garden space on the property; Cable TV and high-speed internet available
- Laundry & utility: Washer; Dryer; Utility room on the main level
Neighborhood map
What this means for you Summary
Snapshot
- This is a 3-bed/1.0-bath single-family listed at $305k.
Deal economics
- At list price, monthly cash flow is $-241 ($-3k/yr) — negative.
- To cash-flow at today's rent, offer at most $262k (13.9% below list).
- To meet the 1% rule (rent ≥ 1% of price), the offer needs to be $216k (29.2% below list).
- Recommended offer: $216k (29.2% below list) — sets the bar for 1% rule.
- Cap rate 5.3% vs local median 3.0% in Port Orchard — top-decile yield for the area; either an underpriced asset or a hidden risk that comps aren't pricing in. Stress-test before assuming the spread holds.
Location & tenants
- Location reads 79/100 on livability (#110 in WA, #2,167 nationally) — a middle-class / working-renter tenant base. Strengths: amenities A+, employment A+, housing A+; Watch: crime D-, commute F, cost of living F.
- South Kitsap School District (suburban): math 52% / reading 64% proficiency, ranked #71 of 291 in WA (top 24%) — acceptable for families but not a draw, mixed tenant base, ~2y average lease.
- Market conditions: Rents flat; 251 active listings in the ZIP; 10 comparable units currently listed for rent nearby; rentals at typical pace (median 21d on market — plan ~3-4 weeks tenant-placement turnaround); solid renter incomes; 1,294 units permitted in Kitsap County in 2024 (302 in 5+ unit buildings).
Forward outlook
- Local home prices are declining (-3.0%/yr); year-one equity from $2k of loan paydown is wiped out by about $9k of value loss. Plan a longer hold.
- Kitsap County population projected at +8% by 2050 — modest demand growth; plan on rents tracking national, not racing it.
Negotiation context
- It's been on market 49 days — a 3% lower offer ($296k) is reasonable based on typical stale-listing flexibility.
- 3 sale attempts since 5y ago with the ask held roughly flat each time — persistent listings suggest the price (not the market) is what's stuck; bring a comps-based counter.
Risks & watch-outs
- Watch-outs: built in 1949 — expect roof / HVAC / electrical / plumbing capex.
Questions for the listing agent
- What do current leases actually rent for vs. the listed asking? Can we see a recent rent roll and the last 12 months of T-12 income?
- It's been on market 49 days. Have you received any prior offers? Is the seller open to a 29% concession, seller financing, or rate buy-down credit?
- Built in 1949 — when were the roof, HVAC, electrical panel, plumbing, and water heater last replaced?
- Is there a deadline driving the sale (1031 exchange, divorce, estate, relocation)? That informs how much negotiation room exists.
- Schools are A-rated — typically a magnet for longer-tenancy family renters. What's the average tenant stay here, and is there a school-zone premium baked into asking?
- Crime grade is D in this area — have there been break-ins, vandalism, or insurance claims at this property in the last 3 years? What carrier currently insures it and at what premium?
- The area grade is low — what's the realistic commute time and amenity access for the typical tenant pool here? Any planned neighborhood developments (good or bad) we should know about?
- What's the average days-on-market for RENTAL listings here right now (not sales)? A rising rental-DOM trend means longer vacancies and softer asking-rent achievability than the comps imply.
- What's the recent tenant-quality profile in this submarket — average credit score on applications, eviction rate, late-payment / NSF rate, and stable-employment percentage? A property-management company in the area should have these aggregated.
- How much new for-sale + rental construction is in the pipeline within 1–3 miles? Heavy new supply typically softens prices + rents 12–24 months out; constrained supply supports both.
Investment metrics
- 1% rule
- 0.71% ✗
- Cap rate
- 5.35%
- Cash-on-cash
- -3.38%
- DSCR
- 0.85
- GRM
- 11.8
CMA / ARV
- ARV (median comp)
- $357,180
- List price
- $305,000
- Delta
- -14.61%
- Verdict
- UNDERPRICED
- Comps
- 20 within 1.0 mi
Show comp detail 10 sales within ~0.75 mi
| Address | Dist | Beds/Ba | Sqft | Sold | Price | $/sf | Match |
|---|---|---|---|---|---|---|---|
| 977 Grant Ave | 0.03mi | 3/2.0 | 960 (-1%) | 21mo | $400,000 | $417 | 76 |
| 921 Cline Ave | 0.31mi | 3/1.0 | 968 (-0%) | 18mo | $360,000 | $372 | 71 |
| 1209 Sherman Ave | 0.28mi | 3/1.0 | 1,056 (+9%) | 11mo | $390,000 | $369 | 63 |
| 620 Hull Ave | 0.21mi | 2/1.0 (-1) | 1,074 (+11%) | 6mo | $332,000 | $309 | 62 |
| 1205 Sherman Ave | 0.27mi | 3/1.0 | 1,056 (+9%) | 18mo | $365,000 | $346 | 58 |
| 533 Forest Park St | 0.43mi | 3/2.0 | 1,095 (+13%) | 1mo | $360,000 | $329 | 54 |
| 612 Smith St | 0.34mi | 3/1.0 | 1,056 (+9%) | 22mo | $364,000 | $345 | 51 |
| 140 Tremont St | 0.65mi | 2/1.0 (-1) | 1,012 (+4%) | 11mo | $424,000 | $419 | 48 |
| 1411 West Ave | 0.53mi | 2/1.5 (-1) | 1,050 (+8%) | 12mo | $354,000 | $337 | 44 |
| 1427 Garrison Ave | 0.56mi | 2/1.0 (-1) | 836 (-14%) | 11mo | $395,000 | $472 | 36 |
Match score weights: distance 35% · size 25% · config 20% · recency 20%. Top-matched comps best support the ARV.
Projected returns pro-forma
-3.0% appreciation · 0.35% rent growth · sell at horizon
- IRR
- -24.7%
- Equity multiple
- 0.18×
- Total profit
- $-70,434
- Equity at exit
- $45,476
- IRR
- -29.7%
- Equity multiple
- -0.21×
- Total profit
- $-103,169
- Equity at exit
- $26,371
Cash invested: $85,400 (down + closing). Projections, not guarantees.
Landlord ↔ Tenant lean methodology
- Overall (STATE)
- 28 Tenant-Leaning
- State Washington
- 28 Tenant-Leaning · D+8
- County
- — inherits STATE
- City
- — inherits STATE
ZIP-level market 98366
- Rents YoY
- 0.3%
- Active inventory
- 251
- Price-to-rent
- 11.8×
Monthly cashflow live
- Estimated rent
- $2,158 high interval (Pro) →
- Mortgage (P&I)
- −$1,599
- Tax from tax record
- −$219 /mo · $2,629/yr
- Insurance
- −$127
- HOA
- −$0
- Vacancy / Maint / Mgmt
- −$453
- Net cashflow
- $-241
Break-even live
UW: 25.0% down · 7.5% · 30yr · 1.5% tax · 5.0% vac · 8.0% maint · 8.0% mgmt
Financing live
Cash to close
- Down payment
- $76,250
- Closing costs
- $9,150
- Reserves months
- —
- Total cash needed
- —
Loan-product check · same deal, 3 products live
Conventional
25% down · 7.5% · 30yr
- Down + closing
- —
- Monthly P&I
- —
- Monthly cashflow
- —
- DSCR
- —
- Eligible?
- —
Personal DTI + credit; lowest rate.
DSCR
20% down · 8.5% · 30yr
- Down + closing
- —
- Monthly P&I
- —
- Monthly cashflow
- —
- DSCR
- —
- Eligible?
- —
No personal income docs; deal must DSCR.
Hard money
10% down · 12.0% · 12mo
- Down + closing
- —
- Monthly P&I
- —
- Monthly cashflow
- —
- DSCR
- —
- Eligible?
- —
Short-term bridge; refi at stabilization.
Rent comps 10 comps
| Address | Beds | Baths | Sqft | Rent | $/sqft | DOM | Units | Dist |
|---|---|---|---|---|---|---|---|---|
| 502 Kendall St Port Orchard, WA | 2.0 | 1.5 | 1008 | $1,950 | $1.93 | 13d | 1 | 0.21mi |
| 1329 Sherman Ave Port Orchard, WA | 2.0 | 1.0 | 912 | $2,100 | $2.30 | 43d | 1 | 0.40mi |
| 515 Forest Park St Port Orchard, WA | 3.0 | 2.0 | 1107 | $2,650 | $2.39 | 13d | 1 | 0.41mi |
| 1324 Garrison Ave Port Orchard, WA | 2.0 | 1.0 | 864 | $2,000 | $2.31 | 21d | 1 | 0.42mi |
| 240 Poplar St Port Orchard, WA | 3.0 | 2.0 | 1022 | $1,995 | $1.95 | 44d | 1 | 0.81mi |
| 1800 Sidney Ave Port Orchard, WA | 1.0–3.0 | 1.0–2.0 | 869 | $2,222 | $2.56 | 13d | 13 | 0.88mi |
| 2843 Harold Dr SE Unit B Port Orchard, WA | 2.0 | 2.0 | 1054 | $1,725 | $1.64 | 21d | 1 | 0.93mi |
| 2099 Jefferson Ave SE Port Orchard, WA | 1.0–2.0 | 1.0 | 750 | $1,705 | $2.27 | 21d | 4 | 0.95mi |
| 339 Farragut Ave N Port Orchard, WA | 3.0 | 1.0 | 947 | $3,000 | $3.17 | 13d | 1 | 1.31mi |
| 2250 Sidney Ave Port Orchard, WA | 1.0–2.0 | 1.0 | 700 | $1,625 | $2.32 | 43d | 4 | 1.42mi |
Listing history 23 events
-
2026-06-18days on market $305,000 Active 49 DOM
-
2026-06-17days on market $305,000 Active 48 DOM
-
2026-06-16days on market $305,000 Active 47 DOM
-
2026-06-15days on market $305,000 Active 46 DOM
-
2026-06-14days on market $305,000 Active 44 DOM
-
2026-06-13days on market $305,000 Active 43 DOM
-
2026-06-10days on market $305,000 Active 41 DOM
-
2026-06-09days on market $305,000 Active 40 DOM
-
2026-06-08days on market $305,000 Active 39 DOM
-
2026-06-07days on market $305,000 Active 38 DOM
-
2026-06-05days on market $305,000 Active 35 DOM
-
2026-06-03days on market $305,000 Active 34 DOM
-
2026-06-02days on market $305,000 Active 33 DOM
-
2026-06-01days on market $305,000 Active 32 DOM
-
2026-05-31days on market $305,000 Active 31 DOM
-
2026-05-30days on market $305,000 Active 30 DOM
-
2026-05-15status Active
-
2026-05-09status Pending
-
2026-05-06price $310,000
-
2026-04-24$315,000 Active
-
2021-11-05soldstatus $294,000 Closed
-
2021-08-29status Pending
-
2021-08-20$299,000 Active
ⓘ Source: listings_history table (triggers on properties + properties_extension) + one-shot
backfill from property_details.listing_events for pre-trigger history.
Tax reassessment forecast WA · Resets to sale price
- Current annual tax
- $2,629 · $219/mo
- Projected year-2 tax
- $2,989 · $249/mo
- Expected delta
- +$360/yr (+$30/mo · 13.7%)
ⓘ Screening estimate from a state-policy table — verify with the county assessor before closing.
Climate risk First Street
- Flood 1/10 Low FEMA zone X (unshaded) · 0% chance over 30 yrs
- Wildfire 1/10 Low
- Heat 3/10 Moderate 7 d/yr ≥86°F today · 14 d/yr by 30 yrs out
- Wind 1/10 Low
- Air quality 7/10 Severe 9 unhealthy d/yr today · 10 by 30 yrs out
Nearby sold comps map
Loading sold comps map…
Walkable amenities ~0.75 mi
Loading nearby amenities…
Taxation est. · year 1
- Rental income
- $25,896
- − Mortgage interest
- −$17,085
- − Property taxes
- −$2,629
- − Insurance
- −$1,525
- − Repairs & maintenance
- −$2,072
- − Management
- −$2,072
- − Depreciation
- −$8,873
- Taxable loss
- −$8,359
- Est. tax savings @ 24.0%
- +$2,006
- After-tax cash flow
- $-884/yr
For passive investors: Depreciation is non-cash, so a rental often shows a tax loss while cash-flowing — sheltering income. Rental losses are passive: they offset passive income freely, and up to $25,000/yr can offset ordinary (W-2) income if you actively participate and your MAGI is under $100k (phasing out to $0 by $150k); unused losses carry forward. On sale, claimed depreciation is recaptured at up to 25%, and gains may owe capital-gains tax (a 1031 exchange can defer both). Figures are a year-1 estimate at your 24.0% rate — not tax advice; consult a CPA.
Schools (NCES district)
- District
- South Kitsap School District
- NCES district ID
- 5308160
- Math proficiency
- 52% ▲ 2.00%
- Reading proficiency
- 64% ▲ 3.00%
- Median HH income
- $62,824
- Composite
- 52.31/100
- National rank
- #3445
- State rank
- #71 of 291 in WA
Livability — Port Orchard
- Score
- 79/100
- State rank
- #110
- US rank
- #2167
Category grades
Schools grade is shown separately in the Schools card above.
Census & demographics
- Census place
- Port Orchard, WA
- County
- Kitsap County · 243,099 people
- City population
- 68,721
- Metro
- Bremerton-Silverdale-Port Orchard, WA
- Population (ZIP)
- 36,965
- Household income
- $92,011
- Rent vs Own
- Severe rent burden
- 1031.0
Population outlook (Kitsap County) Hauer SSP2
- Today (2025)
- 277,525 people
- By 2030
- 285,040 · +2.7%
- By 2040
- 294,957 · +6.3%
- By 2050
- 300,622 · +8.3%
- By 2075
- 315,580 · +13.7%
- By 2100
- 304,340 · +9.7%
Race, ethnicity, and origin ACS 2023
- Neighborhood character
- Predominantly White (74%)
- Race & ethnicity
- White 74% Two or more races 13% Hispanic / Latino 11% Asian 4% Black 2%
- Hispanic origin (detail)
- Mexican 5% Puerto Rican 3%
- Common ancestry
- Italian 9% Portuguese 4% Slovak 3%
- Foreign-born
- 5% · Canada, China, South Korea
- Languages at home
- 93% English-only · Spanish 3% Tagalog/Filipino 1% Other Asian/Pacific 1%
Political lean MEDSL · Kitsap
- 2024 margin
- Strong D (+20.9) · D 58.8% · R 37.9% · Other 3.3%
- 2008→2024 swing
- +8.6pp toward D · 2008: 12.3pp · 2024: 20.9pp
- All cycles
- 2024: D+20.9 2020: D+18.1 2016: D+11.6 2012: D+11.1 2008: D+12.3
Not yet ingested
- Civics
- —
Market trends
- HPI YoY
- ▼ -432.79%
- Current HPI
- 354.2856
- Rent YoY
- ▲ 0.35%
- Metro
- Bremerton-Silverdale-Port Orchard, WA
- State GDP YoY
- ▲ 4.65%
- F500 in state
- 22
Industry mix (Fortune 500 HQ in WA)
| Industry | F500 HQs | Revenue |
|---|---|---|
| Retail | 2 | $269B |
|
||
| Technology / Retail | 1 | $638B |
|
||
| Technology | 1 | $245B |
|
||
| Telecommunications | 1 | $38B |
|
||
| Food / Beverage | 1 | $36B |
|
||
| Automotive / Trucks | 1 | $34B |
|
||
Price history
+2.0% since first listed8 events — show timeline
- 2026-05-25 Price Changed $305,000 NWMLS as Distributed by MLS Grid
- 2026-05-15 Relisted — NWMLS as Distributed by MLS Grid
- 2026-05-09 Pending — NWMLS as Distributed by MLS Grid
- 2026-05-06 Price Changed $310,000 NWMLS as Distributed by MLS Grid
- 2026-04-24 Listed $315,000 NWMLS as Distributed by MLS Grid
- 2021-11-05 Sold (MLS) $294,000 NWMLS as Distributed by MLS Grid
- 2021-08-29 Pending — NWMLS as Distributed by MLS Grid
- 2021-08-20 Listed $299,000 NWMLS as Distributed by MLS Grid
Property tax history
+3.4%/yrLatest (2026): $2,629 · +1.0% YoY. Source: county tax records.
Cash-flow waterfall
monthlySold comps — $/sqft
last 12 mo · ≤1 miLoading sold comps…