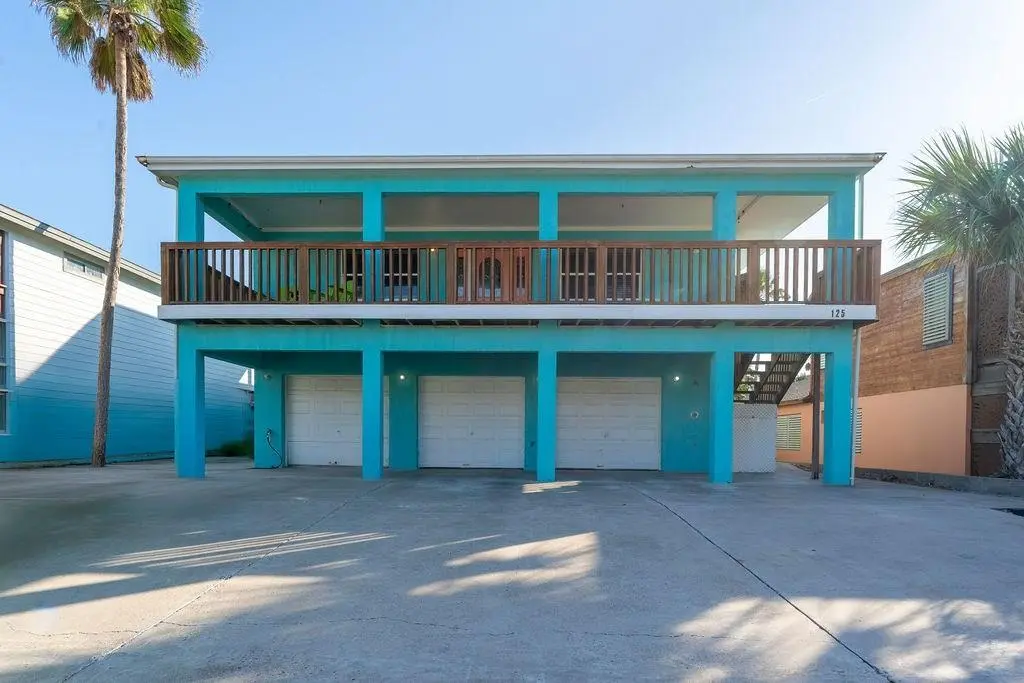
125 E Huisache St Unit A, B & C
South Padre Island, TX 78597
$949,000D
6 bd · 6.4 ba ·
3,883 sqft ·
Built 1997
· MultiFamily
· Active
· 126 DOM
Cashflow @ list (25.0% down · 7.5%)
Estimated rent
$7,564/mo
Mortgage (P&I)
−$4,977
Tax + insurance
−$1,648
HOA
−$0
Vac / Maint / Mgmt
−$1,588
Net cashflow
$-649/mo
Annual
$-7,791/yr
Cap rate
5.56%
Cash-on-cash
-2.63%
DSCR
0.88
1% rule
0.80%
Cash to close
$265,720
Investor read
- This is a 2 × 3-bed/?-bath units multifamily listed at $949k. Condition is rated good.
- At list price, monthly cash flow is $-649 ($-8k/yr) — negative. Per door: $-325/mo.
- To cash-flow at today's rent, offer at most $855k (9.9% below list).
- To meet the 1% rule (rent ≥ 1% of price), the offer needs to be $756k (20.3% below list).
- It's been on market 126 days — a 12% lower offer ($835k) is reasonable based on typical stale-listing flexibility.
- Recommended offer: $756k (20.3% below list) — sets the bar for 1% rule.
- Local home prices are declining (-3.0%/yr); year-one equity from $7k of loan paydown is wiped out by about $28k of value loss. Plan a longer hold.
- Location reads 60/100 on livability (#1,077 in TX) — a middle-class / working-renter tenant base. Strengths: housing B; Watch: amenities C-, schools F, crime F.
- Point Isabel ISD (town): math 14% / reading 31% proficiency, ranked #756 of 826 in TX (top 92%) — low school quality limits family demand, transient renter base, plan for 1-2y turnover.
- Watch-outs: flood insurance adds $66/mo.
- Market conditions: 522 active listings in the ZIP; 2,326 units permitted in Cameron County in 2024 (503 in 5+ unit buildings).
- Cameron County population projected at +3% by 2050 — modest demand growth; plan on rents tracking national, not racing it.
- 2 sale attempts with the ask held roughly flat each time — persistent listings suggest the price (not the market) is what's stuck; bring a comps-based counter.
- Climate carrying-cost: severe flood risk; severe wind risk, 99% chance of damaging wind over 30y; extreme-heat days projected 8→30/yr by 2055 (HVAC capex compounding) — expect insurance premiums to compound above CPI over the hold.
- Cap rate 5.6% vs local median 1.8% in South Padre Island — top-decile yield for the area; either an underpriced asset or a hidden risk that comps aren't pricing in. Stress-test before assuming the spread holds.
- At $7,564/mo this rent would consume 133% of the median local household income ($68k/yr) (locally 96% of renters already pay >50% of income on rent) — very limited rent-growth headroom before tenants either downsize or default.
Questions for listing agent
- What do current leases actually rent for vs. the listed asking? Can we see a recent rent roll and the last 12 months of T-12 income?
- It's been on market 126 days. Have you received any prior offers? Is the seller open to a 20% concession, seller financing, or rate buy-down credit?
- Can we see the unit-by-unit rent roll, current vacancy, and any below-market leases? What's the average tenancy length?
- What capital expenditures (roof, boiler, parking lot, exteriors) have been made in the last 5 years, and what's planned in the next 2?
- What's the actual annual flood-insurance premium (NFIP or private), and is the property in a SFHA with mandatory coverage?
- Why hasn't it sold? Are there any deal-killer items the seller is aware of (foundation, flood, title, zoning, code violations)?
- Is there a deadline driving the sale (1031 exchange, divorce, estate, relocation)? That informs how much negotiation room exists.
- Schools are F-rated, which usually means shorter tenancies and higher turnover. Who's the typical renter profile here, and what's been the actual vacancy rate?
Repairs flagged (vision-AI assessment)
- Moderate: kitchen cabinets — dated and in need of replacement
- Moderate: bathroom fixtures — standard fixtures, outdated design
- Moderate: kitchen appliances — outdated appliances, need replacement
CashFlowRE · CFR-414XHVB9T2AEM6
· Data 2 days ago
cashflowre.app · 2026-05-29