 Duplex
125 E Huisache St Unit A, B & C · South Padre Island, TX
Flood risk 8/10 · Major
- FEMA flood zone
- X (shaded)
- Chance of flooding over 30 yrs
- 0.99%
- Est. flood insurance / yr
- $507 – $1,088
Fire risk 1/10 · Minimal
- Est. fire insurance / yr
- $1,222 – $2,270
Heat risk 10/10 · Severe
- Hot days now (above 105°F)
- 8 days/yr
- Hot days in 30 yrs
- 30 days/yr
Wind risk 9/10 · Severe
- Chance of severe wind over 30 yrs
- 99.0%
Air-quality risk 2/10 · Minimal
- Unhealthy air days now
- 0 days/yr
- Unhealthy air days in 30 yrs
- 1 days/yr
Risk factors via First Street. Map © Google.
Why this score? — see what drove the D grade
The composite is a weighted blend of 9 inputs, each scored 0–100. Each bar is that input's sub-score; the figure is the points it added to the 100-point composite (weight × sub-score).
- ARV discount +15.0/15.0
- Cash flow +9.9/30.0
- Condition / age +4.0/5.0
- 1% rule +3.0/10.0
- Livability +3.0/5.0
- DSCR +2.8/10.0
- Rent growth +2.5/5.0
- Schools +1.9/10.0
- Appreciation +0.0/10.0
$949,000
🖨 Deal sheet 📄 Offer letter ✓ Due diligence
Multi-family units
County records classify this as Multi-Family (2-4 Unit). Listing-text estimate: 2 units. confirmed
Listing remarks MLS
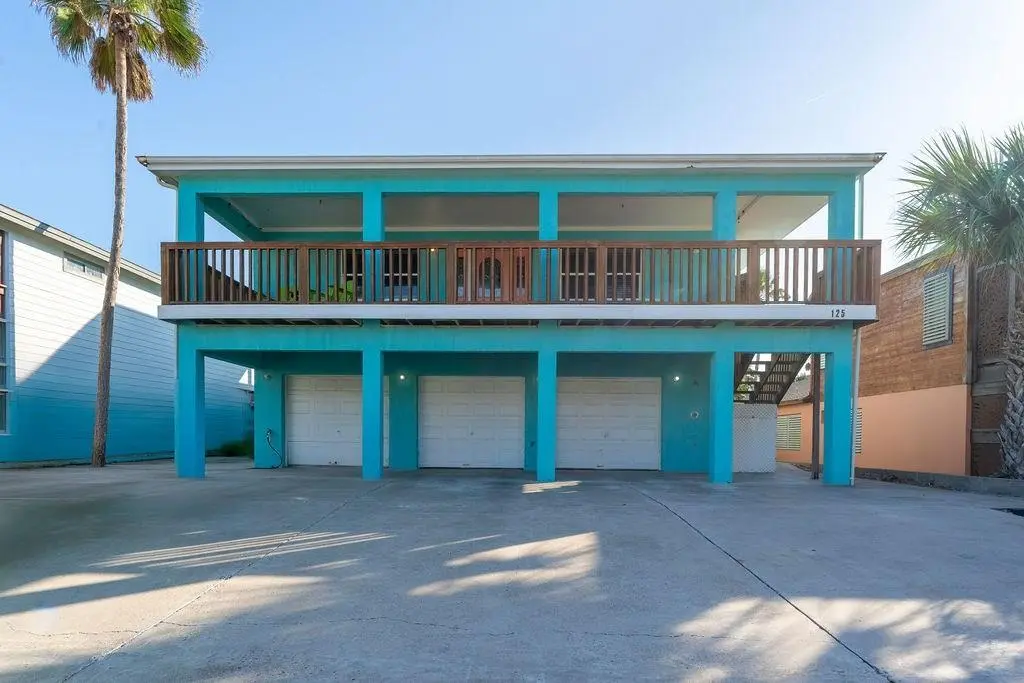
Incredible Investment Opportunity on Sunny South Padre Island! Discover this unique tri-plex, perfectly situated on the east side, just a short stroll from the beach. This property features: Three Separate Garages with covered parking Outdoor Showers Heated & Chilled Pool Hot Tub Each unit offers distinct charm and functionality: Unit A (North): A well-designed 2-bedroom, 2-bath unit with a spacious private covered deck. Unit B (Bottom South): A cozy 2-bedroom, 2-bath unit with direct access to the pool area. Unit C (Top South): A spacious 2-level, 2-bedroom, 2.5-bath unit, featuring a large kitchen, built-in bar, and two private decks with rare ocean views from the third level. With three separate water and electric meters, this property is ideal for long-term rentals. Whether you prefer short-term, long-term, or living in one unit and renting the others, the possibilities are endless!
Key facts
- Hot tub
- Tri-plex
- Outdoor showers
Tags
Neighborhood map
What this means for you Summary
Snapshot
- This is a 2 × 3-bed/?-bath units multifamily listed at $949k. Condition is rated good.
Deal economics
- At list price, monthly cash flow is $-649 ($-8k/yr) — negative. Per door: $-325/mo.
- To cash-flow at today's rent, offer at most $855k (9.9% below list).
- To meet the 1% rule (rent ≥ 1% of price), the offer needs to be $756k (20.3% below list).
- Recommended offer: $756k (20.3% below list) — sets the bar for 1% rule.
- Cap rate 5.6% vs local median 1.8% in South Padre Island — top-decile yield for the area; either an underpriced asset or a hidden risk that comps aren't pricing in. Stress-test before assuming the spread holds.
Location & tenants
- Location reads 60/100 on livability (#1,077 in TX) — a middle-class / working-renter tenant base. Strengths: housing B; Watch: amenities C-, schools F, crime F.
- Point Isabel ISD (town): math 14% / reading 31% proficiency, ranked #756 of 826 in TX (top 92%) — low school quality limits family demand, transient renter base, plan for 1-2y turnover.
- Market conditions: 522 active listings in the ZIP; 2,326 units permitted in Cameron County in 2024 (503 in 5+ unit buildings).
- At $7,564/mo this rent would consume 133% of the median local household income ($68k/yr) (locally 96% of renters already pay >50% of income on rent) — very limited rent-growth headroom before tenants either downsize or default.
Forward outlook
- Local home prices are declining (-3.0%/yr); year-one equity from $7k of loan paydown is wiped out by about $28k of value loss. Plan a longer hold.
- Cameron County population projected at +3% by 2050 — modest demand growth; plan on rents tracking national, not racing it.
Negotiation context
- It's been on market 126 days — a 12% lower offer ($835k) is reasonable based on typical stale-listing flexibility.
- 2 sale attempts with the ask held roughly flat each time — persistent listings suggest the price (not the market) is what's stuck; bring a comps-based counter.
Risks & watch-outs
- Watch-outs: flood insurance adds $66/mo.
- Climate carrying-cost: severe flood risk; severe wind risk, 99% chance of damaging wind over 30y; extreme-heat days projected 8→30/yr by 2055 (HVAC capex compounding) — expect insurance premiums to compound above CPI over the hold.
Questions for the listing agent
- What do current leases actually rent for vs. the listed asking? Can we see a recent rent roll and the last 12 months of T-12 income?
- It's been on market 126 days. Have you received any prior offers? Is the seller open to a 20% concession, seller financing, or rate buy-down credit?
- Can we see the unit-by-unit rent roll, current vacancy, and any below-market leases? What's the average tenancy length?
- What capital expenditures (roof, boiler, parking lot, exteriors) have been made in the last 5 years, and what's planned in the next 2?
- What's the actual annual flood-insurance premium (NFIP or private), and is the property in a SFHA with mandatory coverage?
- Why hasn't it sold? Are there any deal-killer items the seller is aware of (foundation, flood, title, zoning, code violations)?
- Is there a deadline driving the sale (1031 exchange, divorce, estate, relocation)? That informs how much negotiation room exists.
- Schools are F-rated, which usually means shorter tenancies and higher turnover. Who's the typical renter profile here, and what's been the actual vacancy rate?
- Crime grade is F in this area — have there been break-ins, vandalism, or insurance claims at this property in the last 3 years? What carrier currently insures it and at what premium?
- The area grade is low — what's the realistic commute time and amenity access for the typical tenant pool here? Any planned neighborhood developments (good or bad) we should know about?
- What's the average days-on-market for RENTAL listings here right now (not sales)? A rising rental-DOM trend means longer vacancies and softer asking-rent achievability than the comps imply.
- What's the recent tenant-quality profile in this submarket — average credit score on applications, eviction rate, late-payment / NSF rate, and stable-employment percentage? A property-management company in the area should have these aggregated.
- How much new apartment / multifamily construction is in the pipeline within 1–3 miles? Heavy new supply (>2% of stock underway) typically softens rents 12–24 months out; light construction supports rent growth.
Investment metrics
- 1% rule
- 0.80% ✗
- Cap rate
- 5.56%
- Cash-on-cash
- -2.63%
- DSCR
- 0.88
- GRM
- 10.5
CMA / ARV
- ARV (median comp)
- $1,677,378
- List price
- $949,000
- Delta
- -43.42%
- Verdict
- UNDERPRICED
- Comps
- 2 within 1.0 mi
Projected returns pro-forma
-3.0% appreciation · 3.0% rent growth · sell at horizon
- IRR
- -21.2%
- Equity multiple
- 0.27×
- Total profit
- $-194,973
- Equity at exit
- $141,499
- IRR
- -14.6%
- Equity multiple
- 0.16×
- Total profit
- $-222,394
- Equity at exit
- $82,052
Cash invested: $265,720 (down + closing). Projections, not guarantees.
Landlord ↔ Tenant lean methodology
- Overall (STATE)
- 87 Strongly Landlord-Friendly
- State Texas
- 87 Strongly Landlord-Friendly · R+5
- County
- — inherits STATE
- City
- — inherits STATE
ZIP-level market 78597
- Home prices YoY
- -13.5%
- Active inventory
- 522
- Price-to-rent
- 20.9×
Monthly cashflow live
- Estimated rent
- $7,564 high interval (Pro) →
- Mortgage (P&I)
- −$4,977
- Tax est. 1.5%
- −$1,186 /mo · $14,235/yr
- Insurance
- −$395
- Flood insurance flood zone
- −$66 /mo · $798/yr
- HOA
- −$0
- Vacancy / Maint / Mgmt
- −$1,588
- Net cashflow
- $-649
Break-even live
2-unit breakdown (identical units grouped — click to expand)
| Units | Beds | Baths | Est. rent |
|---|---|---|---|
| 2× units | 3 | — | $7,564 |
| #1 | 3 | — | $3,782 |
| #2 | 3 | — | $3,782 |
| Total (2 units) | $7,564 | ||
UW: 25.0% down · 7.5% · 30yr · 1.5% tax · 5.0% vac · 8.0% maint · 8.0% mgmt
Financing live
Cash to close
- Down payment
- $237,250
- Closing costs
- $28,470
- Reserves months
- —
- Total cash needed
- —
Loan-product check · same deal, 3 products live
Conventional
25% down · 7.5% · 30yr
- Down + closing
- —
- Monthly P&I
- —
- Monthly cashflow
- —
- DSCR
- —
- Eligible?
- —
Personal DTI + credit; lowest rate.
DSCR
20% down · 8.5% · 30yr
- Down + closing
- —
- Monthly P&I
- —
- Monthly cashflow
- —
- DSCR
- —
- Eligible?
- —
No personal income docs; deal must DSCR.
Hard money
10% down · 12.0% · 12mo
- Down + closing
- —
- Monthly P&I
- —
- Monthly cashflow
- —
- DSCR
- —
- Eligible?
- —
Short-term bridge; refi at stabilization.
Listing history 18 events
-
2026-06-18days on market $949,000 Active 126 DOM
-
2026-06-17days on market $949,000 Active 125 DOM
-
2026-06-16days on market $949,000 Active 124 DOM
-
2026-06-15days on market $949,000 Active 123 DOM
-
2026-06-14days on market $949,000 Active 121 DOM
-
2026-06-13days on market $949,000 Active 120 DOM
-
2026-06-10days on market $949,000 Active 118 DOM
-
2026-06-09days on market $949,000 Active 117 DOM
-
2026-06-09days on market $949,000 Active 116 DOM
-
2026-06-07pricedays on market $949,000 Active 115 DOM
-
2026-06-03days on market $985,000 Active 111 DOM
-
2026-06-02days on market $985,000 Active 110 DOM
-
2026-06-01days on market $985,000 Active 109 DOM
-
2026-05-31days on market $985,000 Active 108 DOM
-
2026-05-30days on market $985,000 Active 107 DOM
-
2026-02-13$985,000 Active 911-char remark
Show marketing remark (911 chars)
Incredible Investment Opportunity on Sunny South Padre Island! Discover this unique tri-plex, perfectly situated on the east side, just a short stroll from the beach. This property features: Three Separate Garages with covered parking Outdoor Showers Heated & Chilled Pool Hot Tub Each unit offers distinct charm and functionality: Unit A (North): A well-designed 2-bedroom, 2-bath unit with a spacious private covered deck. Unit B (Bottom South): A cozy 2-bedroom, 2-bath unit with direct access to the pool area. Unit C (Top South): A spacious 2-level, 2-bedroom, 2.5-bath unit, featuring a large kitchen, built-in bar, and two private decks with rare ocean views from the third level. With three separate water and electric meters, this property is ideal for long-term rentals. Whether you prefer short-term, long-term, or living in one unit and renting the others, the possibilities are endless!
-
2025-11-20price $985,000
-
2025-10-03$995,000 Active
ⓘ Source: listings_history table (triggers on properties + properties_extension) + one-shot
backfill from property_details.listing_events for pre-trigger history.
Climate risk First Street
- Flood 8/10 Severe FEMA zone X (shaded) · 99% chance over 30 yrs
- Wildfire 1/10 Low
- Heat 10/10 Extreme 8 d/yr ≥105°F today · 30 d/yr by 30 yrs out
- Wind 9/10 Extreme 99% chance of damaging wind over 30 yrs
- Air quality 2/10 Low 0 unhealthy d/yr today · 1 by 30 yrs out
Nearby sold comps map
Loading sold comps map…
Walkable amenities ~0.75 mi
Loading nearby amenities…
Taxation est. · year 1
- Rental income
- $90,768
- − Mortgage interest
- −$53,159
- − Property taxes
- −$14,235
- − Insurance
- −$5,542
- − Repairs & maintenance
- −$7,261
- − Management
- −$7,261
- − Depreciation
- −$27,607
- Taxable loss
- −$24,298
- Est. tax savings @ 24.0%
- +$5,832
- After-tax cash flow
- $-1,959/yr
For passive investors: Depreciation is non-cash, so a rental often shows a tax loss while cash-flowing — sheltering income. Rental losses are passive: they offset passive income freely, and up to $25,000/yr can offset ordinary (W-2) income if you actively participate and your MAGI is under $100k (phasing out to $0 by $150k); unused losses carry forward. On sale, claimed depreciation is recaptured at up to 25%, and gains may owe capital-gains tax (a 1031 exchange can defer both). Figures are a year-1 estimate at your 24.0% rate — not tax advice; consult a CPA.
Condition & rehab AI · 12 photos
This triplex on South Padre Island is in good condition with cosmetic updates needed to modernize the kitchen and bathrooms. The property is well-maintained and has a great location.
Repairs flagged
- Moderate kitchen cabinets — dated and in need of replacement
- Moderate bathroom fixtures — standard fixtures, outdated design
- Moderate kitchen appliances — outdated appliances, need replacement
Value-add opportunities
- Both update kitchen cabinets — modernizes kitchen and increases value
- Both update bathroom fixtures — modernizes bathrooms and increases value
- Both replace kitchen appliances — modernizes kitchen and increases value
Renovation cost estimate screening
| Repair item | Severity | Est. cost |
|---|---|---|
| kitchen cabinets · dated and in need of replacement | Moderate | $3,000–15,000 |
| bathroom fixtures · standard fixtures, outdated design | Moderate | $3,000–15,000 |
| kitchen appliances · outdated appliances, need replacement | Moderate | $3,000–15,000 |
| Total estimated repair cost · 3 items | $9,000–45,000 |
Value-add ROI direction
- Both update kitchen cabinets — modernizes kitchen and increases value ↑
- Both update bathroom fixtures — modernizes bathrooms and increases value ↑
- Both replace kitchen appliances — modernizes kitchen and increases value ↑
ⓘ Cost ranges are severity-bucket heuristics (US national rule-of-thumb). Get contractor quotes + a written scope before underwriting a rehab budget.
Schools (NCES district)
- District
- Point Isabel ISD
- NCES district ID
- 4835250
- Math proficiency
- 14% ▼ -24.00%
- Reading proficiency
- 31% ▼ -10.00%
- Median HH income
- $38,115
- Composite
- 18.78/100
- National rank
- #8871
- State rank
- #756 of 826 in TX
Livability — South Padre Island
- Score
- 60/100
- State rank
- #1077
- US rank
- #19107
Category grades
Schools grade is shown separately in the Schools card above.
Census & demographics
- Census place
- South Padre Island, TX
- County
- Cameron County · 310,734 people
- Metro
- Brownsville-Harlingen, TX
- Population (ZIP)
- 2,935
- Household income
- $68,421
- Rent vs Own
- Severe rent burden
- 96.0
Population outlook (Cameron County) Hauer SSP2
- Today (2025)
- 441,603 people
- By 2030
- 448,113 · +1.5%
- By 2040
- 456,385 · +3.3%
- By 2050
- 456,294 · +3.3%
- By 2075
- 423,851 · -4.0%
- By 2100
- 342,787 · -22.4%
Race, ethnicity, and origin ACS 2023
- Neighborhood character
- Predominantly White (76%)
- Race & ethnicity
- White 76% Hispanic / Latino 15% Two or more races 7% Black 6% Asian 2%
- Hispanic origin (detail)
- Mexican 14%
- Common ancestry
- Slovak 5% Lithuanian 4% German 2%
- Foreign-born
- 13% · Canada
- Languages at home
- 88% English-only · Spanish 11% Other Indo-European 1%
Political lean MEDSL · Cameron
- 2024 margin
- Lean R (+5.8) · D 46.7% · R 52.5%
- 2008→2024 swing
- -34.6pp toward R · 2008: 28.8pp · 2024: -5.8pp
- All cycles
- 2024: R+5.8 2020: D+13.2 2016: D+32.5 2012: D+32.4 2008: D+28.8
Not yet ingested
- Civics
- —
Market trends
- HPI YoY
- ▼ -66.59%
- Current HPI
- 425.29
- Rent YoY
- —
- Metro
- Brownsville-Harlingen, TX
- State GDP YoY
- ▲ 3.95%
- F500 in state
- 110
Industry mix (Fortune 500 HQ in TX)
| Industry | F500 HQs | Revenue |
|---|---|---|
| Energy | 16 | $1,198B |
|
||
| Technology | 5 | $198B |
|
||
| Engineering / Construction | 4 | $72B |
|
||
| Energy Services | 3 | $60B |
|
||
| Utilities | 3 | $41B |
|
||
| Healthcare | 2 | $330B |
|
||
Price history
-1.0% since first listed3 events — show timeline
- 2026-02-13 Listed $985,000 SPIBOR
- 2025-11-20 Price Changed $985,000 SPIBOR
- 2025-10-03 Listed $995,000 SPIBOR
Cash-flow waterfall
monthlySold comps — $/sqft
last 12 mo · ≤1 miLoading sold comps…