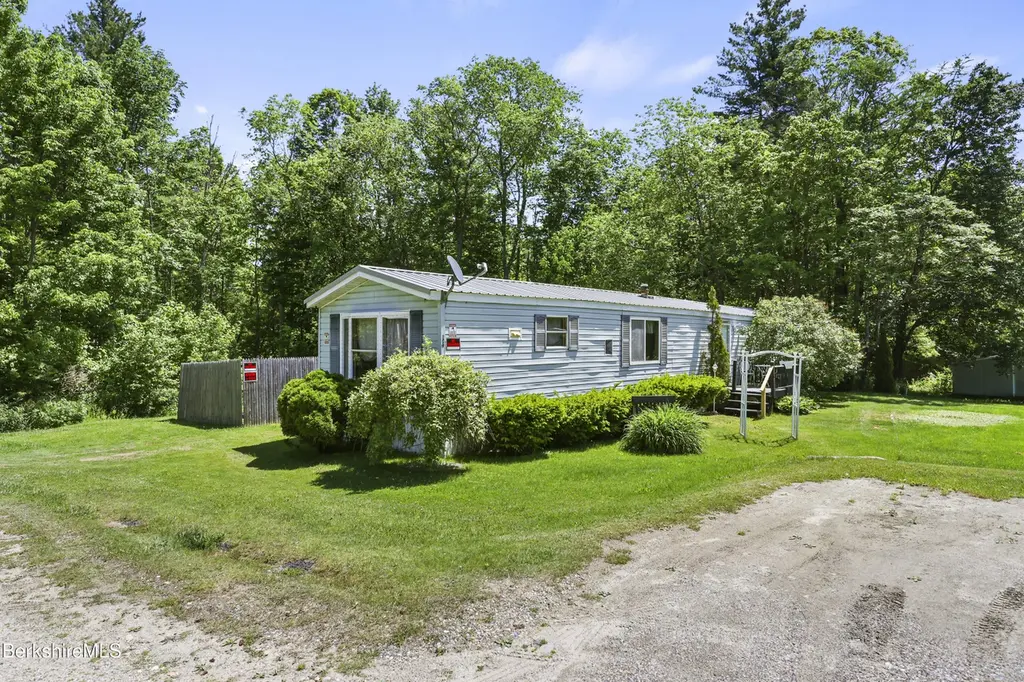
14 Alice Dr
Pittsfield, MA 01235
$79,914B
2 bd · 2.0 ba ·
980 sqft ·
Built 1991
· SingleFamily
· Active
· 8 DOM
Cashflow @ list (25.0% down · 7.5%)
Estimated rent
$1,139/mo
Mortgage (P&I)
−$419
Tax + insurance
−$133
HOA
−$0
Vac / Maint / Mgmt
−$239
Net cashflow
$348/mo
Annual
$4,172/yr
Cap rate
11.51%
Cash-on-cash
18.64%
DSCR
1.83
1% rule
1.43%
Cash to close
$22,376
Investor read
- This is a 2-bed/2.0-bath single-family listed at $80k.
- At list price, monthly cash flow is $348 ($4k/yr) — positive.
- The deal already cash-flows at list — no discount required.
- Meets the 1% rule at list price ($1k rent vs $80k).
- Only 8 days on market — expect competitive offers; lowballing is unlikely to land.
- In year one you build about $376 of equity ($552 loan paydown + $-176 appreciation (-0.2% local appreciation)).
- Location reads 75/100 on livability (#70 in MA, #3,820 nationally) — a middle-class / working-renter tenant base. Strengths: commute A+, housing A+, health & safety A+; Watch: employment C-, amenities D+, crime D.
- Central Berkshire (rural): math 32% / reading 47% proficiency, ranked #206 of 302 in MA (top 68%) — families likely to look elsewhere, expect single-tenant / working-renter base with shorter leases.
- Zoned schools: Kittredge (math 34% / reading 44%, grade F, #504 of 938 statewide, top 57%, 161 students, 0% FRL); Nessacus Regional Middle School (math 27% / reading 44%, grade F, #175 of 305 statewide, top 58%, 345 students, 0% FRL); Wahconah Regional High (math 47% / reading 62%, grade C-, #157 of 343 statewide, top 47%, 485 students, 0% FRL) — zoned schools average 0% FRL vs 26% district-wide (26 pts lower); this property's tenant base skews higher-income than the district average.
- Market conditions: 28 active listings in the ZIP; 130 units permitted in Berkshire County in 2024 (10 in 5+ unit buildings).
- Berkshire County population projected at -24% by 2050 — secular population decline; favor cash flow + early exit over multi-decade hold.
- 4 sale attempts since 30y ago with the ask held roughly flat each time — persistent listings suggest the price (not the market) is what's stuck; bring a comps-based counter.
- Current owner paid $30k; list at $80k implies a 166% gain — meaningful room to come down on a strong offer.
- At projected returns (-0.2% appreciation + 3.0% rent growth), your $22k cash investment doubles in ~5 years — after that, you're playing with house money.
- Cap rate 11.5% vs local median 3.6% in Pittsfield — top-decile yield for the area; either an underpriced asset or a hidden risk that comps aren't pricing in. Stress-test before assuming the spread holds.
Questions for listing agent
- Is there a deadline driving the sale (1031 exchange, divorce, estate, relocation)? That informs how much negotiation room exists.
- Schools are D-rated, which usually means shorter tenancies and higher turnover. Who's the typical renter profile here, and what's been the actual vacancy rate?
- Crime grade is D in this area — have there been break-ins, vandalism, or insurance claims at this property in the last 3 years? What carrier currently insures it and at what premium?
- What's the average days-on-market for RENTAL listings here right now (not sales)? A rising rental-DOM trend means longer vacancies and softer asking-rent achievability than the comps imply.
- What's the recent tenant-quality profile in this submarket — average credit score on applications, eviction rate, late-payment / NSF rate, and stable-employment percentage? A property-management company in the area should have these aggregated.
- How much new for-sale + rental construction is in the pipeline within 1–3 miles? Heavy new supply typically softens prices + rents 12–24 months out; constrained supply supports both.
CashFlowRE · CFR-419XMC69439QCJ
· Data 1 day ago
cashflowre.app · 2026-05-29