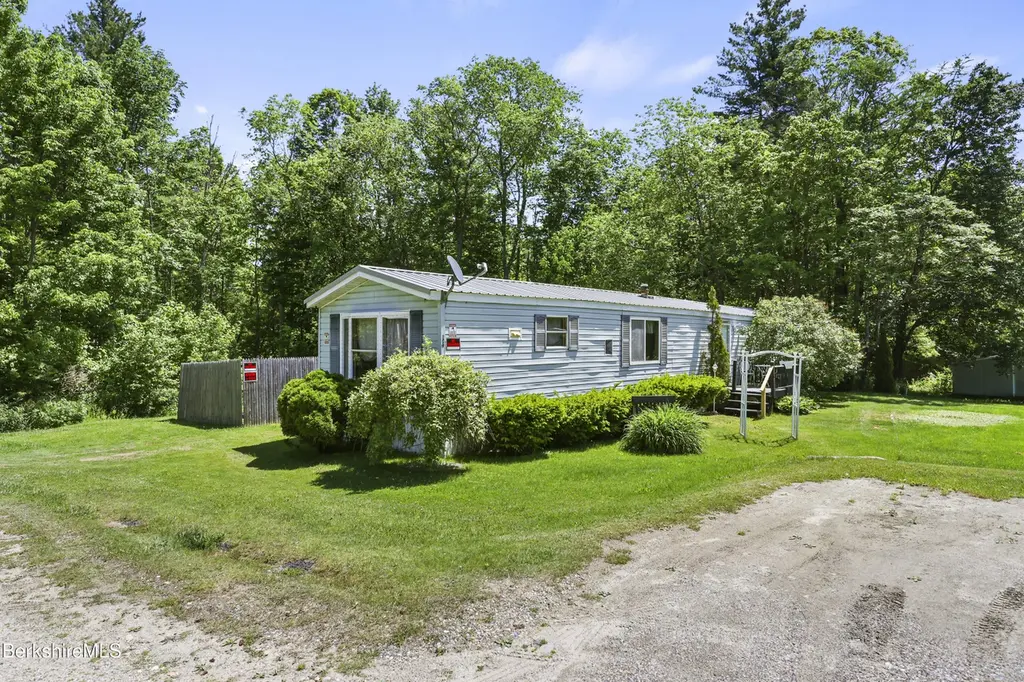
14 Alice Dr · Pittsfield, MA
Flood risk No data
- FEMA flood zone
- —
- Chance of flooding over 30 yrs
- —
- Est. flood insurance / yr
- —
Fire risk No data
- Est. fire insurance / yr
- —
Heat risk 1/10 · Minimal
- Hot days now (above threshold)
- 7 days/yr
- Hot days in 30 yrs
- 17 days/yr
Wind risk No data
- Chance of severe wind over 30 yrs
- —
Air-quality risk 2/10 · Minimal
- Unhealthy air days now
- 1 days/yr
- Unhealthy air days in 30 yrs
- 1 days/yr
Risk factors via First Street. Map © Google.
Why this score? — see what drove the B grade
The composite is a weighted blend of 9 inputs, each scored 0–100. Each bar is that input's sub-score; the figure is the points it added to the 100-point composite (weight × sub-score).
- Cash flow +30.0/30.0
- DSCR +10.0/10.0
- 1% rule +9.3/10.0
- ARV discount +7.5/15.0
- Appreciation +4.9/10.0
- Livability +3.8/5.0
- Schools +3.5/10.0
- Rent growth +2.5/5.0
- Condition / age +2.5/5.0
$79,914
🖨 Deal sheet (PDF) 📄 Offer letter ✓ Due diligence
Listing remarks
Discover peaceful living in this 2 bed, 2 bath mobile home, tucked away as the last unit at the end of the street. Enjoy the privacy and quiet that comes with having no through traffic and a serene setting. This owner-occupied home has a lot rent of $430./month. Pets are welcome with a license, making it the perfect spot. Affordable, private, comfortable, a wonderful place to call home. Needs work!! Being sold ''as is''.
Key facts
- 2 parking spots
- Built 1991
- Listed 8 days
Property features AI
Exterior
- Utilities: 100 amp electric service; Other sewer
- Home design: General property subtype
- Construction: Metal roof; Total building area 980
- Exterior features: Deck; Outbuilding; Private trash service
Interior
- Kitchen: Refrigerator; Freezer
- Bedrooms: 4 total rooms (includes bedrooms and living spaces)
- Flooring: Carpet; Laminate; Linoleum
- Bathrooms: 2 full bathrooms
- Heating & cooling: Has heating
- Interior features: Cable available; Accessible full bathroom; First-floor bedroom with bath; Accessible bedroom; Pets allowed with restrictions
- Laundry & utility: Washer
Neighborhood map
What this means for you Summary
Snapshot
- This is a 2-bed/2.0-bath single-family listed at $80k.
Deal economics
- At list price, monthly cash flow is $348 ($4k/yr) — positive.
- The deal already cash-flows at list — no discount required.
- Meets the 1% rule at list price ($1k rent vs $80k).
- Cap rate 11.5% vs local median 3.6% in Pittsfield — top-decile yield for the area; either an underpriced asset or a hidden risk that comps aren't pricing in. Stress-test before assuming the spread holds.
Location & tenants
- Location reads 75/100 on livability (#70 in MA, #3,820 nationally) — a middle-class / working-renter tenant base. Strengths: commute A+, housing A+, health & safety A+; Watch: employment C-, amenities D+, crime D.
- Central Berkshire (rural): math 32% / reading 47% proficiency, ranked #206 of 302 in MA (top 68%) — families likely to look elsewhere, expect single-tenant / working-renter base with shorter leases.
- Zoned schools: Kittredge (math 34% / reading 44%, grade F, #504 of 938 statewide, top 57%, 161 students, 0% FRL); Nessacus Regional Middle School (math 27% / reading 44%, grade F, #175 of 305 statewide, top 58%, 345 students, 0% FRL); Wahconah Regional High (math 47% / reading 62%, grade C-, #157 of 343 statewide, top 47%, 485 students, 0% FRL) — zoned schools average 0% FRL vs 26% district-wide (26 pts lower); this property's tenant base skews higher-income than the district average.
- Market conditions: 28 active listings in the ZIP; 130 units permitted in Berkshire County in 2024 (10 in 5+ unit buildings).
Forward outlook
- In year one you build about $376 of equity ($552 loan paydown + $-176 appreciation (-0.2% local appreciation)).
- Berkshire County population projected at -24% by 2050 — secular population decline; favor cash flow + early exit over multi-decade hold.
- At projected returns (-0.2% appreciation + 3.0% rent growth), your $22k cash investment doubles in ~5 years — after that, you're playing with house money.
Negotiation context
- Only 8 days on market — expect competitive offers; lowballing is unlikely to land.
- 4 sale attempts since 30y ago with the ask held roughly flat each time — persistent listings suggest the price (not the market) is what's stuck; bring a comps-based counter.
- Current owner paid $30k; list at $80k implies a 166% gain — meaningful room to come down on a strong offer.
Questions for the listing agent
- Is there a deadline driving the sale (1031 exchange, divorce, estate, relocation)? That informs how much negotiation room exists.
- Schools are D-rated, which usually means shorter tenancies and higher turnover. Who's the typical renter profile here, and what's been the actual vacancy rate?
- Crime grade is D in this area — have there been break-ins, vandalism, or insurance claims at this property in the last 3 years? What carrier currently insures it and at what premium?
- What's the average days-on-market for RENTAL listings here right now (not sales)? A rising rental-DOM trend means longer vacancies and softer asking-rent achievability than the comps imply.
- What's the recent tenant-quality profile in this submarket — average credit score on applications, eviction rate, late-payment / NSF rate, and stable-employment percentage? A property-management company in the area should have these aggregated.
- How much new for-sale + rental construction is in the pipeline within 1–3 miles? Heavy new supply typically softens prices + rents 12–24 months out; constrained supply supports both.
Investment metrics
- 1% rule
- 1.43% ✓
- Cap rate
- 11.51%
- Cash-on-cash
- 18.64%
- DSCR
- 1.83
- GRM
- 5.8
CMA / ARV
No comps found within radius.
Projected returns pro-forma
-0.22% appreciation · 3.0% rent growth · sell at horizon
- IRR
- 17.8%
- Equity multiple
- 1.85×
- Total profit
- $18,996
- Equity at exit
- $22,327
- IRR
- 22.5%
- Equity multiple
- 3.44×
- Total profit
- $54,684
- Equity at exit
- $26,147
Cash invested: $22,376 (down + closing). Projections, not guarantees.
Landlord ↔ Tenant lean methodology
- Overall (STATE)
- 20 Strongly Tenant-Friendly
- State Massachusetts
- 20 Strongly Tenant-Friendly · D+15
- County
- — inherits STATE
- City
- — inherits STATE
ZIP-level market 01235
- Home prices YoY
- -0.1%
- Active inventory
- 28
- Price-to-rent
- 5.8×
Monthly cashflow live
- Estimated rent
- $1,139 medium interval (Pro) →
- Mortgage (P&I)
- −$419
- Tax est. 1.5%
- −$100 /mo · $1,199/yr
- Insurance
- −$33
- HOA
- −$0
- Vacancy / Maint / Mgmt
- −$239
- Net cashflow
- $348
Break-even live
Sensitivity live
| Price | -10% $403 | -5% $375 | +0% $348 | +5% $320 | +10% $292 |
|---|---|---|---|---|---|
| Rent | -10% $258 | -5% $303 | +0% $348 | +5% $393 | +10% $438 |
| Rate | -1.0pp $388 | -0.5pp $368 | base $348 | +0.5pp $327 | +1.0pp $306 |
UW: 25.0% down · 7.5% · 30yr · 1.5% tax · 5.0% vac · 8.0% maint · 8.0% mgmt
Financing live
Cash to close
- Down payment
- $19,978
- Closing costs
- $2,397
- Reserves months
- —
- Total cash needed
- —
Loan-product check · same deal, 3 products live
Conventional
25% down · 7.5% · 30yr
- Down + closing
- —
- Monthly P&I
- —
- Monthly cashflow
- —
- DSCR
- —
- Eligible?
- —
Personal DTI + credit; lowest rate.
DSCR
20% down · 8.5% · 30yr
- Down + closing
- —
- Monthly P&I
- —
- Monthly cashflow
- —
- DSCR
- —
- Eligible?
- —
No personal income docs; deal must DSCR.
Hard money
10% down · 12.0% · 12mo
- Down + closing
- —
- Monthly P&I
- —
- Monthly cashflow
- —
- DSCR
- —
- Eligible?
- —
Short-term bridge; refi at stabilization.
Listing history 9 events
-
2026-06-19days on market $79,914 Active 8 DOM
-
2026-06-18remarks 425-char remark
-
2026-06-18days on market $79,914 Active 7 DOM
-
2026-06-17days on market $79,914 Active 6 DOM
-
2026-06-16days on market $79,914 Active 5 DOM
-
2026-06-15days on market $79,914 Active 4 DOM
-
2026-06-14days on market $79,914 Active 2 DOM
-
2026-06-12remarks 411-char remark
-
2026-06-12$79,914 Active 1 DOM
ⓘ Source: listings_history table (triggers on properties + properties_extension) + one-shot
backfill from property_details.listing_events for pre-trigger history.
Climate risk First Street
- Heat 1/10 Low
- Air quality 2/10 Low 1 unhealthy d/yr today · 1 by 30 yrs out
Nearby sold comps map
Loading sold comps map…
Walkable amenities ~0.75 mi
Loading nearby amenities…
Taxation est. · year 1
- Rental income
- $13,670
- − Mortgage interest
- −$4,476
- − Property taxes
- −$1,199
- − Insurance
- −$400
- − Repairs & maintenance
- −$1,094
- − Management
- −$1,094
- − Depreciation
- −$2,325
- Taxable income
- $3,083
- Est. tax owed @ 24.0%
- −$740
- After-tax cash flow
- $3,432/yr
For passive investors: Depreciation is non-cash, so a rental often shows a tax loss while cash-flowing — sheltering income. Rental losses are passive: they offset passive income freely, and up to $25,000/yr can offset ordinary (W-2) income if you actively participate and your MAGI is under $100k (phasing out to $0 by $150k); unused losses carry forward. On sale, claimed depreciation is recaptured at up to 25%, and gains may owe capital-gains tax (a 1031 exchange can defer both). Figures are a year-1 estimate at your 24.0% rate — not tax advice; consult a CPA.
Schools (NCES district)
- District
- Central Berkshire
- NCES district ID
- 2503390
- Math proficiency
- 32% ▼ -13.00%
- Reading proficiency
- 47% ▲ 1.00%
- Median HH income
- $58,145
- Composite
- 34.8/100
- National rank
- #5108
- State rank
- #206 of 302 in MA
Livability — Pittsfield
- Score
- 75/100
- State rank
- #70
- US rank
- #3820
Category grades
Schools grade is shown separately in the Schools card above.
Census & demographics
- City population
- 44,848
- Population (ZIP)
- 2,456
Population outlook (Berkshire County) Hauer SSP2
- Today (2025)
- 119,723 people
- By 2030
- 114,608 · -4.3%
- By 2040
- 102,806 · -14.1%
- By 2050
- 91,305 · -23.7%
- By 2075
- 71,517 · -40.3%
- By 2100
- 57,988 · -51.6%
Race, ethnicity, and origin ACS 2023
- Neighborhood character
- Predominantly White (95%)
- Race & ethnicity
- White 95% Two or more races 4% Hispanic / Latino 3%
- Common ancestry
- Lithuanian 11% Romanian 9% Slovak 2%
- Foreign-born
- 1%
- Languages at home
- 97% English-only · Spanish 2% Other Asian/Pacific 1%
Political lean MEDSL · Berkshire
- 2024 margin
- Solid D (+39.9) · D 68.9% · R 29.0% · Other 2.1%
- 2008→2024 swing
- -12.5pp toward R · 2008: 52.4pp · 2024: 39.9pp
- All cycles
- 2024: D+39.9 2020: D+47.1 2016: D+41.5 2012: D+53.7 2008: D+52.4
Not yet ingested
- Civics
- —
Market trends
- HPI YoY
- ▼ -0.22%
- Current HPI
- 287.7509
- Rent YoY
- —
- Metro
- —
- State GDP YoY
- ▲ 2.28%
- F500 in state
- 38
Industry mix (Fortune 500 HQ in MA)
| Industry | F500 HQs | Revenue |
|---|---|---|
| Technology | 3 | $17B |
|
||
| Insurance | 2 | $84B |
|
||
| Retail | 2 | $76B |
|
||
| Life Sciences | 1 | $43B |
|
||
| Energy Technology | 1 | $31B |
|
||
| Aerospace / Defense | 1 | $18B |
|
||
Price history
+149.7% since first listed7 events — show timeline
- 2026-06-10 Listed $79,914 BCMLS
- 2002-12-29 Listing Removed — BCMLS
- 2002-06-29 Listed $33,500 BCMLS
- 2002-01-14 Listing Removed — BCMLS
- 2000-07-10 Listed $34,900 BCMLS
- 1996-09-19 Sold (MLS) $30,000 BCMLS
- 1996-05-10 Listed $32,000 BCMLS
Cash-flow waterfall
monthlySold comps — $/sqft
last 12 mo · ≤1 miLoading sold comps…