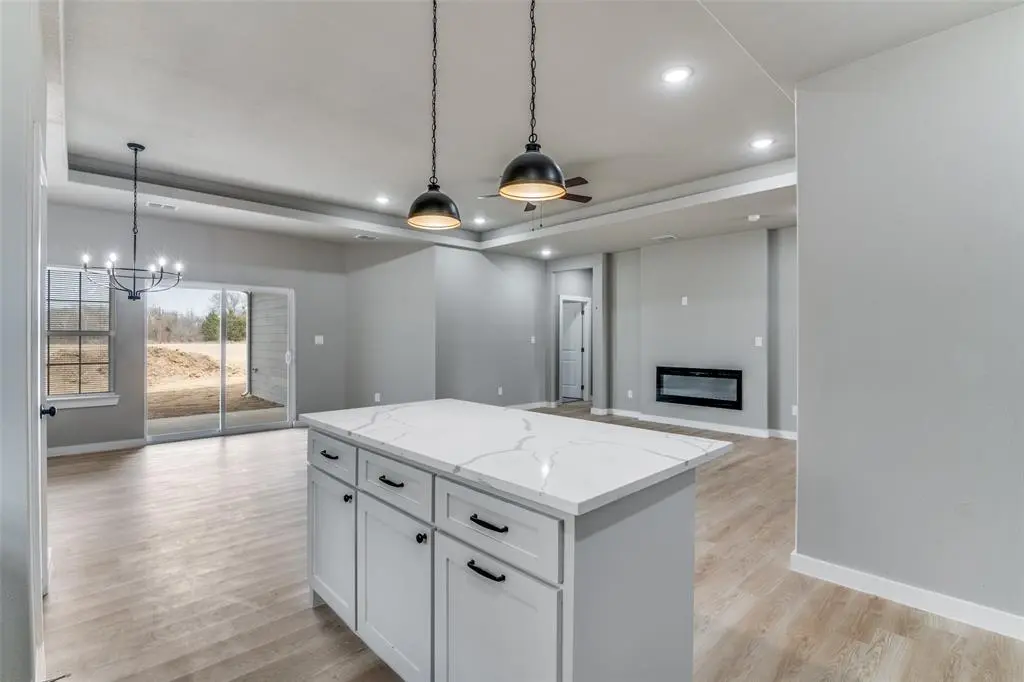
107 Scenic Rd
Trinidad, TX 75163
$289,000D-
3 bd · 2.0 ba ·
1,751 sqft ·
Built 2026
· SingleFamily
· Active
· 15 DOM
Cashflow @ list (25.0% down · 7.5%)
Estimated rent
$1,608/mo
Mortgage (P&I)
−$1,516
Tax + insurance
−$482
HOA
−$15
Vac / Maint / Mgmt
−$338
Net cashflow
$-742/mo
Annual
$-8,907/yr
Cap rate
3.21%
Cash-on-cash
-11.01%
DSCR
0.51
1% rule
0.56%
Cash to close
$80,920
Investor read
- This is a 3-bed/2.0-bath single-family listed at $289k.
- At list price, monthly cash flow is $-742 ($-9k/yr) — negative.
- To cash-flow at today's rent, offer at most $182k (37.2% below list).
- To meet the 1% rule (rent ≥ 1% of price), the offer needs to be $161k (44.4% below list).
- It's been on market 15 days — a 2% lower offer ($285k) is reasonable based on typical stale-listing flexibility.
- Recommended offer: $161k (44.4% below list) — sets the bar for 1% rule.
- In year one you build about $5k of equity ($2k loan paydown + $3k appreciation (1.0% local appreciation)).
- Location reads 57/100 on livability (#1,274 in TX) — a working-class tenant base; expect higher turnover. Strengths: cost of living A+, housing A+; Watch: crime F, amenities F, commute F.
- Malakoff ISD (town): math 48% / reading 54% proficiency, ranked #187 of 826 in TX (top 23%) — acceptable for families but not a draw, mixed tenant base, ~2y average lease; 61% free/reduced lunch — lower-income household profile, screen leases tightly.
- Zoned schools: Malakoff El (math 58% / reading 54%, grade C+, #574 of 4,322 statewide, top 14%, 457 students, 75% FRL).
- Market conditions: 162 active listings in the ZIP; 263 units permitted in Henderson County in 2024 (0 in 5+ unit buildings).
- 2 sale attempts with the ask held roughly flat each time — persistent listings suggest the price (not the market) is what's stuck; bring a comps-based counter.
- By year 7, paydown + projected appreciation supports a ~$34k cash-out refi (75% LTV) — recoverable capital for the next deal without selling this one.
- Climate carrying-cost: major wind risk, 65% chance of damaging wind over 30y; extreme-heat days projected 7→27/yr by 2055 (HVAC capex compounding) — expect insurance premiums to compound above CPI over the hold.
- Cap rate 3.2% vs local median 2.3% in Trinidad — top-decile yield for the area; either an underpriced asset or a hidden risk that comps aren't pricing in. Stress-test before assuming the spread holds.
Questions for listing agent
- What do current leases actually rent for vs. the listed asking? Can we see a recent rent roll and the last 12 months of T-12 income?
- What does the HOA fee cover, when was the last increase, and are there any pending special assessments or reserve-fund shortfalls?
- Is there a deadline driving the sale (1031 exchange, divorce, estate, relocation)? That informs how much negotiation room exists.
- Schools are F-rated, which usually means shorter tenancies and higher turnover. Who's the typical renter profile here, and what's been the actual vacancy rate?
- Crime grade is F in this area — have there been break-ins, vandalism, or insurance claims at this property in the last 3 years? What carrier currently insures it and at what premium?
- The area grade is low — what's the realistic commute time and amenity access for the typical tenant pool here? Any planned neighborhood developments (good or bad) we should know about?
- What's the average days-on-market for RENTAL listings here right now (not sales)? A rising rental-DOM trend means longer vacancies and softer asking-rent achievability than the comps imply.
- What's the recent tenant-quality profile in this submarket — average credit score on applications, eviction rate, late-payment / NSF rate, and stable-employment percentage? A property-management company in the area should have these aggregated.
CashFlowRE · CFR-41MFFPDV5WMRFY
· Data 1 day ago
cashflowre.app · 2026-05-29