107 Scenic Rd · Trinidad, TX
Flood risk 1/10 · Minimal
- FEMA flood zone
- X (unshaded)
- Chance of flooding over 30 yrs
- 0.0%
- Est. flood insurance / yr
- $507 – $1,088
Fire risk 4/10 · Minor
- Est. fire insurance / yr
- $1,222 – $2,270
Heat risk 7/10 · Major
- Hot days now (above 110°F)
- 7 days/yr
- Hot days in 30 yrs
- 27 days/yr
Wind risk 6/10 · Moderate
- Chance of severe wind over 30 yrs
- 65.0%
Air-quality risk 2/10 · Minimal
- Unhealthy air days now
- 0 days/yr
- Unhealthy air days in 30 yrs
- 1 days/yr
Risk factors via First Street. Map © Google.
Why this score? — see what drove the D- grade
The composite is a weighted blend of 9 inputs, each scored 0–100. Each bar is that input's sub-score; the figure is the points it added to the 100-point composite (weight × sub-score).
- ARV discount +15.0/15.0
- Appreciation +5.5/10.0
- Cash flow +4.5/30.0
- Schools +4.3/10.0
- Livability +2.9/5.0
- Rent growth +2.5/5.0
- Condition / age +2.5/5.0
- 1% rule +0.6/10.0
- DSCR +0.0/10.0
$289,000
🖨 Deal sheet 📄 Offer letter ✓ Due diligence
Listing remarks
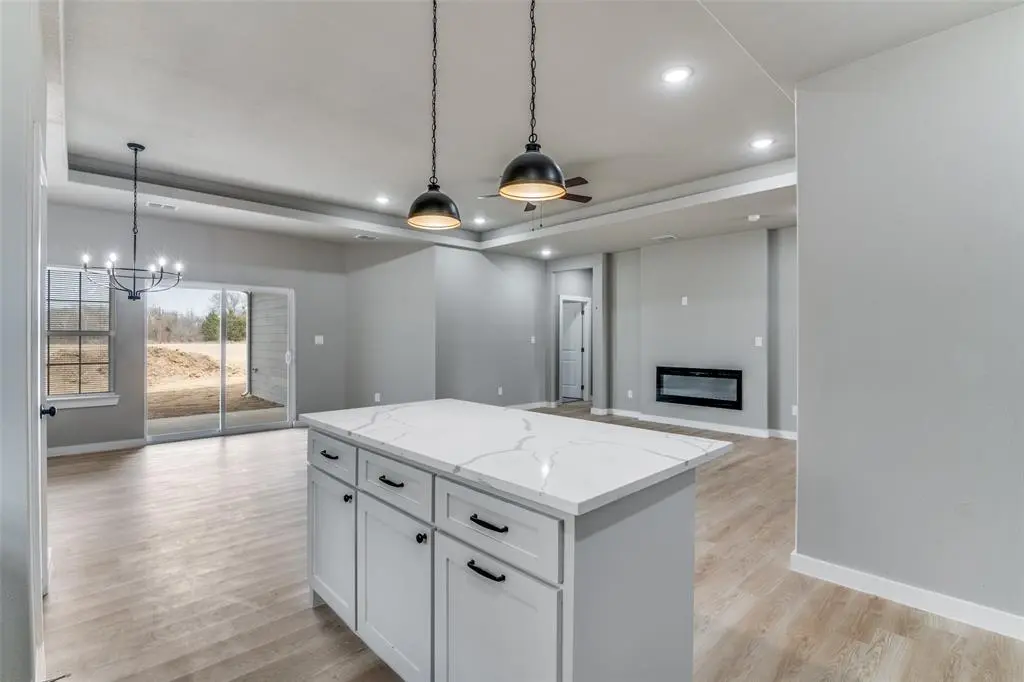
UNIQUE OPEN FLOOR PLAN, MODERN NEW CONSTRUCTION WITH 8 Feet Solid Wood front door. Come and see this open floor plan. It has 3 bedrooms and 2 Full Baths, High Ceilings, quartz countertops, custom-built 42 inch cabinets, tile, carpet and Luxury Flooring. Decorative lighting and Luxury pendant lights. Kitchen island, Slide in Range, Dishwasher and Stainless Steel Vent hood. Shower Glass door and Walk in closet in Master Bedroom. Decorative accents. Foam Insulation and High end Heat Pump HVAC. Exterior front brick with spotlights, garage door opener. Realtors must attend showings. Information deemed reliable, but not guaranteed.
Key facts
- Quartz countertops
- Kitchen island
- Walk in closet
Tags
Property features AI
Finance
- Other: Listing accepts Cash, Conventional, FHA, and VA financing
- HOA & community: Mandatory association (Lakewood POA); Annual association fee of $180; Association fees include full use of facilities
Exterior
- Parking: Attached 2-car garage with garage door opener; Covered parking (2 covered spaces); Concrete driveway with direct access; Garage faces front
- Utilities: City water with individual water meter; Septic; Electricity connected; All-weather road access
- Home design: Single family residence (attached); One story
- Construction: Built in 2026
- Exterior features: Lot less than 0.5 acre (approximately 0.187 acres); Subdivision: Lakewood; Directions note: Please use GPS for 107 Scenic Rd, Trinidad TX 75163
Interior
- Kitchen: Dishwasher; Electric range; Kitchen island; Granite counters; Pantry; Eat-in kitchen
- Bedrooms: 3 bedrooms (all on the main level); Primary bedroom on the main level
- Bathrooms: 2 full bathrooms
- Interior features: Open floorplan with eat-in kitchen; Granite counters; Kitchen island; Pantry; Chandelier and decorative lighting; One living area; One dining area; Decorative electric fireplace
- Laundry & utility: Electric water heater
Neighborhood map
What this means for you Summary
Snapshot
- This is a 3-bed/2.0-bath single-family listed at $289k.
Deal economics
- At list price, monthly cash flow is $-742 ($-9k/yr) — negative.
- To cash-flow at today's rent, offer at most $182k (37.2% below list).
- To meet the 1% rule (rent ≥ 1% of price), the offer needs to be $161k (44.4% below list).
- Recommended offer: $161k (44.4% below list) — sets the bar for 1% rule.
- Cap rate 3.2% vs local median 2.5% in Trinidad — meaningfully above typical; check what's discounted (condition, days-on-market, listing class) to confirm the premium yield is real.
Location & tenants
- Location reads 57/100 on livability (#1,274 in TX) — a working-class tenant base; expect higher turnover. Strengths: cost of living A+, housing A+; Watch: crime F, amenities F, commute F.
- Malakoff ISD (town): math 48% / reading 54% proficiency, ranked #187 of 826 in TX (top 23%) — acceptable for families but not a draw, mixed tenant base, ~2y average lease; 61% free/reduced lunch — lower-income household profile, screen leases tightly.
- Zoned schools: Malakoff El (math 58% / reading 54%, grade C+, #574 of 4,322 statewide, top 14%, 457 students, 75% FRL).
- Market conditions: 162 active listings in the ZIP; 263 units permitted in Henderson County in 2024 (0 in 5+ unit buildings).
Forward outlook
- In year one you build about $5k of equity ($2k loan paydown + $3k appreciation (1.0% local appreciation)).
- By year 7, paydown + projected appreciation supports a ~$34k cash-out refi (75% LTV) — recoverable capital for the next deal without selling this one.
Negotiation context
- It's been on market 15 days — a 2% lower offer ($285k) is reasonable based on typical stale-listing flexibility.
- 2 sale attempts with the ask held roughly flat each time — persistent listings suggest the price (not the market) is what's stuck; bring a comps-based counter.
Risks & watch-outs
- Climate carrying-cost: major wind risk, 65% chance of damaging wind over 30y; extreme-heat days projected 7→27/yr by 2055 (HVAC capex compounding) — expect insurance premiums to compound above CPI over the hold.
Questions for the listing agent
- What do current leases actually rent for vs. the listed asking? Can we see a recent rent roll and the last 12 months of T-12 income?
- What does the HOA fee cover, when was the last increase, and are there any pending special assessments or reserve-fund shortfalls?
- Is there a deadline driving the sale (1031 exchange, divorce, estate, relocation)? That informs how much negotiation room exists.
- Schools are F-rated, which usually means shorter tenancies and higher turnover. Who's the typical renter profile here, and what's been the actual vacancy rate?
- Crime grade is F in this area — have there been break-ins, vandalism, or insurance claims at this property in the last 3 years? What carrier currently insures it and at what premium?
- The area grade is low — what's the realistic commute time and amenity access for the typical tenant pool here? Any planned neighborhood developments (good or bad) we should know about?
- What's the average days-on-market for RENTAL listings here right now (not sales)? A rising rental-DOM trend means longer vacancies and softer asking-rent achievability than the comps imply.
- What's the recent tenant-quality profile in this submarket — average credit score on applications, eviction rate, late-payment / NSF rate, and stable-employment percentage? A property-management company in the area should have these aggregated.
- How much new for-sale + rental construction is in the pipeline within 1–3 miles? Heavy new supply typically softens prices + rents 12–24 months out; constrained supply supports both.
Investment metrics
- 1% rule
- 0.56% ✗
- Cap rate
- 3.21%
- Cash-on-cash
- -11.01%
- DSCR
- 0.51
- GRM
- 15.0
CMA / ARV
- ARV (median comp)
- $487,173
- List price
- $289,000
- Delta
- -40.68%
- Verdict
- UNDERPRICED
- Comps
- 20 within 1.0 mi
Show comp detail 9 sales within ~0.75 mi
| Address | Dist | Beds/Ba | Sqft | Sold | Price | $/sf | Match |
|---|---|---|---|---|---|---|---|
| 105 Scenic Rd | 0.00mi | 3/2.0 | 1,959 (+12%) | 2mo | $295,000 | $151 | 79 |
| 109 Oakdale Rd | 0.17mi | 3/2.0 | 1,555 (-11%) | 9mo | $279,900 | $180 | 66 |
| 104 Water Oak Rd | 0.22mi | 3/2.0 | 1,545 (-12%) | 17mo | $285,000 | $184 | 56 |
| 222 Saint Michaels Cir | 0.51mi | 4/2.0 (+1) | 1,800 (+3%) | 13mo | $275,000 | $153 | 56 |
| 105 Goodknight Ranch Rd | 0.61mi | 3/2.0 | 1,718 (-2%) | 21mo | $445,000 | $259 | 51 |
| 221 St Michaels Cir | 0.51mi | 3/2.0 | 1,848 (+6%) | 22mo | $245,000 | $133 | 48 |
| 106 Deep Cove Dr | 0.74mi | 4/2.0 (+1) | 1,653 (-6%) | 8mo | $299,400 | $181 | 45 |
| 111 Rocking Chair Ranch Rd | 0.67mi | 4/2.5 (+1) | 1,994 (+14%) | 5mo | $460,000 | $231 | 34 |
| 4468 Key Ranch Rd | 0.70mi | 3/2.0 | 1,982 (+13%) | 23mo | $329,999 | $166 | 26 |
Match score weights: distance 35% · size 25% · config 20% · recency 20%. Top-matched comps best support the ARV.
Projected returns pro-forma
1.03% appreciation · 3.0% rent growth · sell at horizon
- IRR
- -10.1%
- Equity multiple
- 0.49×
- Total profit
- $-41,346
- Equity at exit
- $99,179
- IRR
- -4.2%
- Equity multiple
- 0.48×
- Total profit
- $-41,865
- Equity at exit
- $132,203
Cash invested: $80,920 (down + closing). Projections, not guarantees.
Landlord ↔ Tenant lean methodology
- Overall (STATE)
- 87 Strongly Landlord-Friendly
- State Texas
- 87 Strongly Landlord-Friendly · R+5
- County
- — inherits STATE
- City
- — inherits STATE
ZIP-level market 75163
- Home prices YoY
- 0.5%
- Active inventory
- 162
- Price-to-rent
- 15.0×
Monthly cashflow live
- Estimated rent
- $1,608 medium interval (Pro) →
- Mortgage (P&I)
- −$1,516
- Tax est. 1.5%
- −$361 /mo · $4,335/yr
- Insurance
- −$120
- HOA
- −$15
- Vacancy / Maint / Mgmt
- −$338
- Net cashflow
- $-742
Break-even live
UW: 25.0% down · 7.5% · 30yr · 1.5% tax · 5.0% vac · 8.0% maint · 8.0% mgmt
Financing live
Cash to close
- Down payment
- $72,250
- Closing costs
- $8,670
- Reserves months
- —
- Total cash needed
- —
Loan-product check · same deal, 3 products live
Conventional
25% down · 7.5% · 30yr
- Down + closing
- —
- Monthly P&I
- —
- Monthly cashflow
- —
- DSCR
- —
- Eligible?
- —
Personal DTI + credit; lowest rate.
DSCR
20% down · 8.5% · 30yr
- Down + closing
- —
- Monthly P&I
- —
- Monthly cashflow
- —
- DSCR
- —
- Eligible?
- —
No personal income docs; deal must DSCR.
Hard money
10% down · 12.0% · 12mo
- Down + closing
- —
- Monthly P&I
- —
- Monthly cashflow
- —
- DSCR
- —
- Eligible?
- —
Short-term bridge; refi at stabilization.
HOA detail
- Monthly dues
- $15 · $180/yr
Listing history 13 events
-
2026-06-19days on market $289,000 Active 15 DOM
-
2026-06-18days on market $289,000 Active 14 DOM
-
2026-06-17days on market $289,000 Active 13 DOM
-
2026-06-16days on market $289,000 Active 12 DOM
-
2026-06-15days on market $289,000 Active 11 DOM
-
2026-06-14days on market $289,000 Active 9 DOM
-
2026-06-12days on market $289,000 Active 8 DOM
-
2026-06-09days on market $289,000 Active 5 DOM
-
2026-06-08days on market $289,000 Active 4 DOM
-
2026-06-07days on market $289,000 Active 3 DOM
-
2026-05-31days on market $289,000 Active 39 DOM
-
2026-05-30days on market $289,000 Active 38 DOM
-
2026-04-22$289,000 Active 633-char remark
ⓘ Source: listings_history table (triggers on properties + properties_extension) + one-shot
backfill from property_details.listing_events for pre-trigger history.
Climate risk First Street
- Flood 1/10 Low FEMA zone X (unshaded) · 0% chance over 30 yrs
- Wildfire 4/10 Moderate
- Heat 7/10 Severe 7 d/yr ≥110°F today · 27 d/yr by 30 yrs out
- Wind 6/10 Major 65% chance of damaging wind over 30 yrs
- Air quality 2/10 Low 0 unhealthy d/yr today · 1 by 30 yrs out
Nearby sold comps map
Loading sold comps map…
Walkable amenities ~0.75 mi
Loading nearby amenities…
Taxation est. · year 1
- Rental income
- $19,291
- − Mortgage interest
- −$16,188
- − Property taxes
- −$4,335
- − Insurance
- −$1,445
- − Repairs & maintenance
- −$1,543
- − Management
- −$1,543
- − HOA
- −$180
- − Depreciation
- −$8,407
- Taxable loss
- −$14,351
- Est. tax savings @ 24.0%
- +$3,444
- After-tax cash flow
- $-5,462/yr
For passive investors: Depreciation is non-cash, so a rental often shows a tax loss while cash-flowing — sheltering income. Rental losses are passive: they offset passive income freely, and up to $25,000/yr can offset ordinary (W-2) income if you actively participate and your MAGI is under $100k (phasing out to $0 by $150k); unused losses carry forward. On sale, claimed depreciation is recaptured at up to 25%, and gains may owe capital-gains tax (a 1031 exchange can defer both). Figures are a year-1 estimate at your 24.0% rate — not tax advice; consult a CPA.
Schools (NCES district)
- District
- Malakoff ISD
- NCES district ID
- 4828780
- Math proficiency
- 48% ▼ -14.00%
- Reading proficiency
- 54% ▼ -5.00%
- Median HH income
- $38,970
- Composite
- 42.54/100
- National rank
- #3200
- State rank
- #187 of 826 in TX
Livability — Trinidad
- Score
- 57/100
- State rank
- #1274
- US rank
- #22143
Category grades
Schools grade is shown separately in the Schools card above.
Census & demographics
- City population
- 2,569
- Population (ZIP)
- 2,569
Population outlook (Henderson County) Hauer SSP2
- Today (2025)
- 80,471 people
- By 2030
- 80,608 · +0.2%
- By 2040
- 80,087 · -0.5%
- By 2050
- 78,208 · -2.8%
- By 2075
- 72,423 · -10.0%
- By 2100
- 61,012 · -24.2%
Race, ethnicity, and origin ACS 2023
- Neighborhood character
- Predominantly White (77%)
- Race & ethnicity
- White 77% Two or more races 11% Hispanic / Latino 9% Black 6%
- Hispanic origin (detail)
- Mexican 8%
- Common ancestry
- Serbian 3% Lithuanian 1% European 1%
- Foreign-born
- 7% · Canada, Jamaica
- Languages at home
- 84% English-only · Arabic 10% Spanish 6%
Political lean MEDSL · Henderson
- 2024 margin
- Solid R (+63.5) · D 18.0% · R 81.4%
- 2008→2024 swing
- -18.8pp toward R · 2008: -44.6pp · 2024: -63.5pp
- All cycles
- 2024: R+63.5 2020: R+60.2 2016: R+60.0 2012: R+54.8 2008: R+44.6
Not yet ingested
- Civics
- —
Market trends
- HPI YoY
- ▲ 1.03%
- Current HPI
- 211.6125
- Rent YoY
- —
- Metro
- —
- State GDP YoY
- ▲ 3.95%
- F500 in state
- 110
Industry mix (Fortune 500 HQ in TX)
| Industry | F500 HQs | Revenue |
|---|---|---|
| Energy | 16 | $1,198B |
|
||
| Technology | 5 | $198B |
|
||
| Engineering / Construction | 4 | $72B |
|
||
| Energy Services | 3 | $60B |
|
||
| Utilities | 3 | $41B |
|
||
| Healthcare | 2 | $330B |
|
||
Price history
+0.0% since first listed3 events — show timeline
- 2026-06-04 Listed $289,000 NTREIS
- 2026-05-31 Listing Removed — NTREIS
- 2026-04-22 Listed $289,000 NTREIS
Cash-flow waterfall
monthlySold comps — $/sqft
last 12 mo · ≤1 miLoading sold comps…