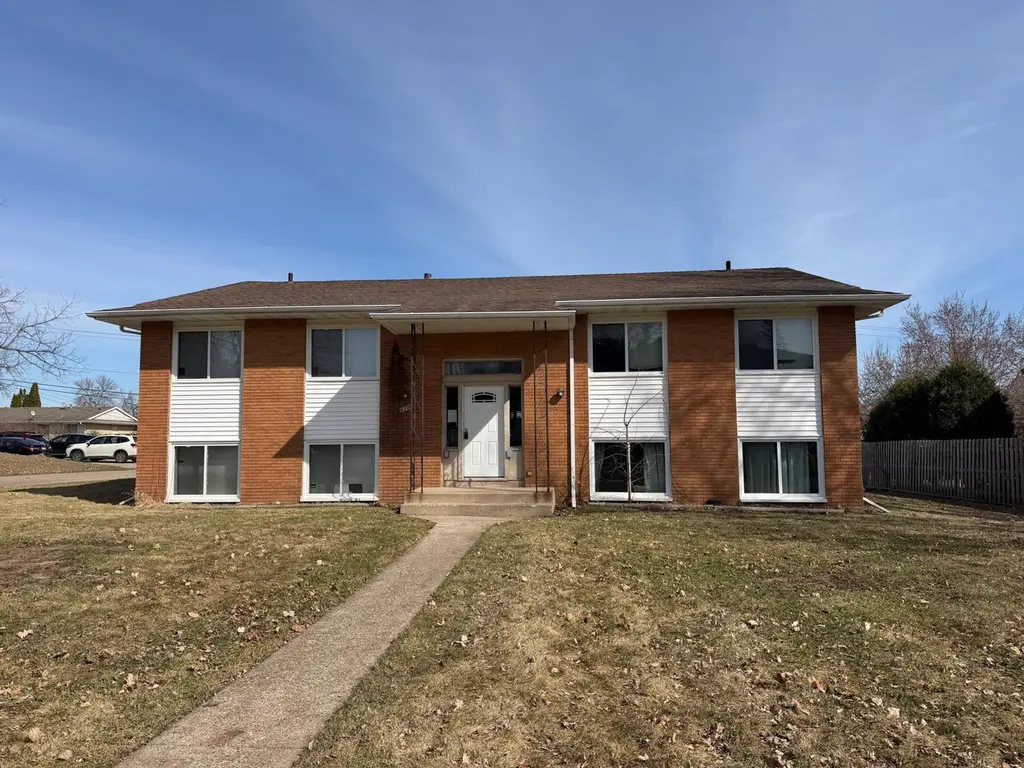
2708 Xylon Ave N
New Hope, MN 55427
$574,900C-
28 bd · 16.0 ba ·
3,300 sqft ·
Built 1963
· MultiFamily
· Active
· 142 DOM
Cashflow @ list (25.0% down · 7.5%)
Estimated rent
$5,867/mo
Mortgage (P&I)
−$3,015
Tax + insurance
−$1,058
HOA
−$0
Vac / Maint / Mgmt
−$1,232
Net cashflow
$562/mo
Annual
$6,747/yr
Cap rate
7.47%
Cash-on-cash
4.19%
DSCR
1.19
1% rule
1.02%
Cash to close
$160,972
Investor read
- This is a 3×2bd/1ba + 1×1bd/1ba units multifamily listed at $575k.
- At list price, monthly cash flow is $562 ($7k/yr) — positive. Per door: $141/mo.
- The deal already cash-flows at list — no discount required.
- Meets the 1% rule at list price ($6k rent vs $575k).
- It's been on market 142 days — a 12% lower offer ($506k) is reasonable based on typical stale-listing flexibility.
- Recommended offer: $506k (12.0% below list) — sets the bar for market timing.
- Local home prices are declining (-3.0%/yr); year-one equity from $4k of loan paydown is wiped out by about $17k of value loss. Plan a longer hold.
- Location reads 86/100 on livability (#9 in MN, #345 nationally) — a professional / high-income tenant draw. Strengths: amenities A+, commute A+, housing A+.
- Robbinsdale Public School District (suburban): math 24% / reading 44% proficiency, ranked #250 of 301 in MN (top 83%) — families likely to look elsewhere, expect single-tenant / working-renter base with shorter leases.
- Market conditions: Rents rising fast (+7.4%/yr); 126 active listings in the ZIP; solid renter incomes; 4,651 units permitted in Hennepin County in 2024 (2,443 in 5+ unit buildings).
- Hennepin County population projected at +30% by 2050 — long-run rental-demand tailwind backs the buy-and-hold thesis.
- 8 sale attempts since 23y ago; this cycle's ask has dropped $50k (8%) from the opening price — seller is motivated, your offer sets the floor, not the list.
- Current owner paid $266k; list at $575k implies a 117% gain — meaningful room to come down on a strong offer.
- At projected returns (-3.0% appreciation + 7.4% rent growth), your $161k cash investment doubles in ~10 years — after that, you're playing with house money.
- Cap rate 7.5% vs local median 3.7% in New Hope — top-decile yield for the area; either an underpriced asset or a hidden risk that comps aren't pricing in. Stress-test before assuming the spread holds.
- At $5,867/mo this rent would consume 76% of the median local household income ($93k/yr) (locally 663% of renters already pay >50% of income on rent) — very limited rent-growth headroom before tenants either downsize or default.
Questions for listing agent
- It's been on market 142 days. Have you received any prior offers? Is the seller open to a 12% concession, seller financing, or rate buy-down credit?
- Can we see the unit-by-unit rent roll, current vacancy, and any below-market leases? What's the average tenancy length?
- What capital expenditures (roof, boiler, parking lot, exteriors) have been made in the last 5 years, and what's planned in the next 2?
- Built in 1963 — when were the roof, HVAC, electrical panel, plumbing, and water heater last replaced?
- Why hasn't it sold? Are there any deal-killer items the seller is aware of (foundation, flood, title, zoning, code violations)?
- Is there a deadline driving the sale (1031 exchange, divorce, estate, relocation)? That informs how much negotiation room exists.
- Schools are B-rated — typically a magnet for longer-tenancy family renters. What's the average tenant stay here, and is there a school-zone premium baked into asking?
- What's the average days-on-market for RENTAL listings here right now (not sales)? A rising rental-DOM trend means longer vacancies and softer asking-rent achievability than the comps imply.
CashFlowRE · CFR-49WK8P752RE0AB
· Data 2 days ago
cashflowre.app · 2026-05-29