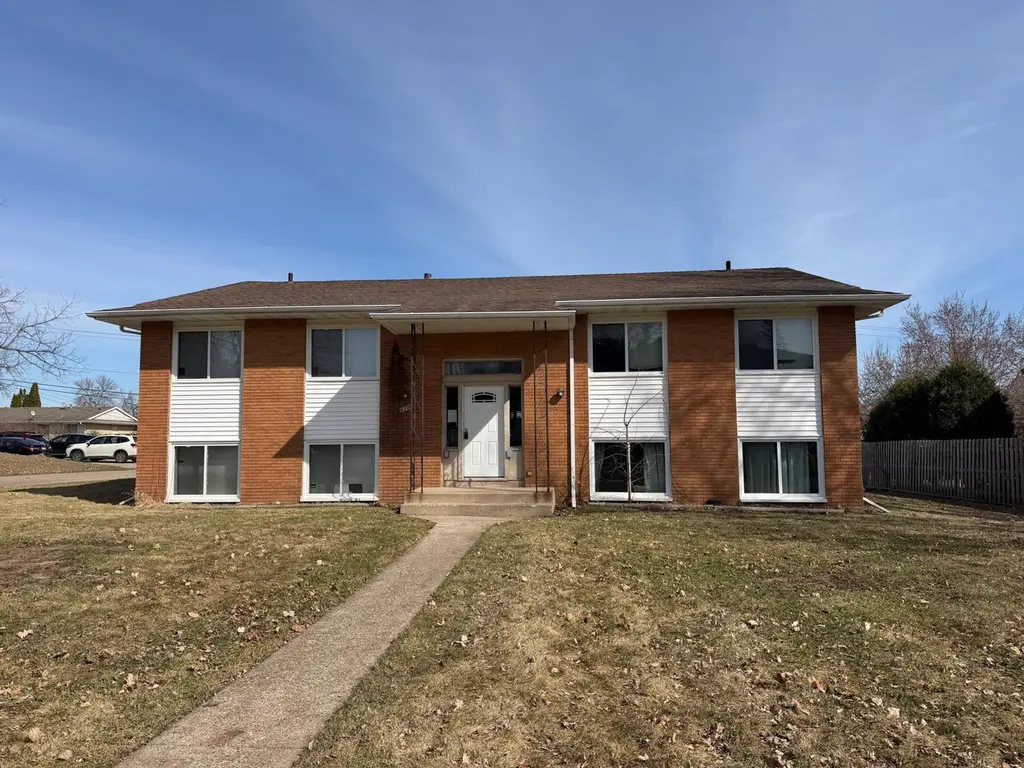
 Fourplex
2708 Xylon Ave N · New Hope, MN
Flood risk 1/10 · Minimal
- FEMA flood zone
- X (unshaded)
- Chance of flooding over 30 yrs
- 0.0%
- Est. flood insurance / yr
- $473 – $860
Fire risk 1/10 · Minimal
- Est. fire insurance / yr
- $888 – $1,650
Heat risk 2/10 · Minimal
- Hot days now (above 99°F)
- 7 days/yr
- Hot days in 30 yrs
- 14 days/yr
Wind risk 2/10 · Minimal
- Chance of severe wind over 30 yrs
- —
Air-quality risk 2/10 · Minimal
- Unhealthy air days now
- 2 days/yr
- Unhealthy air days in 30 yrs
- 2 days/yr
Risk factors via First Street. Map © Google.
Why this score? — see what drove the C- grade
The composite is a weighted blend of 9 inputs, each scored 0–100. Each bar is that input's sub-score; the figure is the points it added to the 100-point composite (weight × sub-score).
- Cash flow +18.6/30.0
- ARV discount +7.5/15.0
- DSCR +5.9/10.0
- 1% rule +5.2/10.0
- Rent growth +4.4/5.0
- Livability +4.3/5.0
- Schools +3.0/10.0
- Condition / age +2.5/5.0
- Appreciation +0.0/10.0
$574,900
🖨 Deal sheet 📄 Offer letter ✓ Due diligence
Multi-family units
County records classify this as Multi-Family (5+ Unit). Listing-text estimate: 4 units. estimate disagrees with records
5+ unit building — per-unit beds/baths from public records are typically unavailable; the breakdown below (if shown) is an estimate from the listing text.
Listing remarks MLS
Rarely available turn-key 4 plex features 3 - 2 bed units and 1 - 1 bed unit! Fully occupied and ready for its next owner. Featuring many updates throughout, this is the opportunity you've been waiting for to add to your portfolio!
Key facts
- 0.34 acre lot
- Built 1963
- Listed 142 days
Neighborhood map
What this means for you Summary
Snapshot
- This is a 3×2bd/1ba + 1×1bd/1ba units multifamily listed at $575k.
Deal economics
- At list price, monthly cash flow is $562 ($7k/yr) — positive. Per door: $141/mo.
- The deal already cash-flows at list — no discount required.
- Meets the 1% rule at list price ($6k rent vs $575k).
- Recommended offer: $506k (12.0% below list) — sets the bar for market timing.
- Cap rate 7.5% vs local median 3.7% in New Hope — top-decile yield for the area; either an underpriced asset or a hidden risk that comps aren't pricing in. Stress-test before assuming the spread holds.
Location & tenants
- Location reads 86/100 on livability (#9 in MN, #345 nationally) — a professional / high-income tenant draw. Strengths: amenities A+, commute A+, housing A+.
- Robbinsdale Public School District (suburban): math 24% / reading 44% proficiency, ranked #250 of 301 in MN (top 83%) — families likely to look elsewhere, expect single-tenant / working-renter base with shorter leases.
- Market conditions: Rents rising fast (+7.4%/yr); 126 active listings in the ZIP; solid renter incomes; 4,651 units permitted in Hennepin County in 2024 (2,443 in 5+ unit buildings).
- At $5,867/mo this rent would consume 76% of the median local household income ($93k/yr) (locally 663% of renters already pay >50% of income on rent) — very limited rent-growth headroom before tenants either downsize or default.
Forward outlook
- Local home prices are declining (-3.0%/yr); year-one equity from $4k of loan paydown is wiped out by about $17k of value loss. Plan a longer hold.
- Hennepin County population projected at +30% by 2050 — long-run rental-demand tailwind backs the buy-and-hold thesis.
- At projected returns (-3.0% appreciation + 7.4% rent growth), your $161k cash investment doubles in ~10 years — after that, you're playing with house money.
Negotiation context
- It's been on market 142 days — a 12% lower offer ($506k) is reasonable based on typical stale-listing flexibility.
- 8 sale attempts since 23y ago; this cycle's ask has dropped $50k (8%) from the opening price — seller is motivated, your offer sets the floor, not the list.
- Current owner paid $266k; list at $575k implies a 117% gain — meaningful room to come down on a strong offer.
Questions for the listing agent
- It's been on market 142 days. Have you received any prior offers? Is the seller open to a 12% concession, seller financing, or rate buy-down credit?
- Can we see the unit-by-unit rent roll, current vacancy, and any below-market leases? What's the average tenancy length?
- What capital expenditures (roof, boiler, parking lot, exteriors) have been made in the last 5 years, and what's planned in the next 2?
- Built in 1963 — when were the roof, HVAC, electrical panel, plumbing, and water heater last replaced?
- Why hasn't it sold? Are there any deal-killer items the seller is aware of (foundation, flood, title, zoning, code violations)?
- Is there a deadline driving the sale (1031 exchange, divorce, estate, relocation)? That informs how much negotiation room exists.
- Schools are B-rated — typically a magnet for longer-tenancy family renters. What's the average tenant stay here, and is there a school-zone premium baked into asking?
- What's the average days-on-market for RENTAL listings here right now (not sales)? A rising rental-DOM trend means longer vacancies and softer asking-rent achievability than the comps imply.
- What's the recent tenant-quality profile in this submarket — average credit score on applications, eviction rate, late-payment / NSF rate, and stable-employment percentage? A property-management company in the area should have these aggregated.
- How much new apartment / multifamily construction is in the pipeline within 1–3 miles? Heavy new supply (>2% of stock underway) typically softens rents 12–24 months out; light construction supports rent growth.
Investment metrics
- 1% rule
- 1.02% ✓
- Cap rate
- 7.47%
- Cash-on-cash
- 4.19%
- DSCR
- 1.19
- GRM
- 8.2
CMA / ARV
No comps found within radius.
Projected returns pro-forma
-3.0% appreciation · 7.4% rent growth · sell at horizon
- IRR
- -4.8%
- Equity multiple
- 0.81×
- Total profit
- $-30,072
- Equity at exit
- $85,719
- IRR
- 9.5%
- Equity multiple
- 1.88×
- Total profit
- $142,438
- Equity at exit
- $49,707
Cash invested: $160,972 (down + closing). Projections, not guarantees.
Landlord ↔ Tenant lean methodology
- Overall (STATE)
- 46 Balanced
- State Minnesota
- 46 Balanced · D+2
- County
- — inherits STATE
- City
- — inherits STATE
ZIP-level market 55427
- Rents YoY
- 7.4%
- Active inventory
- 126
- Price-to-rent
- 31.6×
Monthly cashflow live
- Estimated rent
- $5,867 high interval (Pro) →
- Mortgage (P&I)
- −$3,015
- Tax from tax record
- −$818 /mo · $9,819/yr
- Insurance
- −$240
- HOA
- −$0
- Vacancy / Maint / Mgmt
- −$1,232
- Net cashflow
- $562
Break-even live
4-unit breakdown (identical units grouped — click to expand)
| Units | Beds | Baths | Est. rent |
|---|---|---|---|
| 3× units | 2 | 1 | $4,554 |
| #1 | 2 | 1 | $1,518 |
| #2 | 2 | 1 | $1,518 |
| #3 | 2 | 1 | $1,518 |
| 1× unit | 1 | 1 | $1,312 |
| Total (4 units) | $5,867 | ||
UW: 25.0% down · 7.5% · 30yr · 1.5% tax · 5.0% vac · 8.0% maint · 8.0% mgmt
Financing live
Cash to close
- Down payment
- $143,725
- Closing costs
- $17,247
- Reserves months
- —
- Total cash needed
- —
Loan-product check · same deal, 3 products live
Conventional
25% down · 7.5% · 30yr
- Down + closing
- —
- Monthly P&I
- —
- Monthly cashflow
- —
- DSCR
- —
- Eligible?
- —
Personal DTI + credit; lowest rate.
DSCR
20% down · 8.5% · 30yr
- Down + closing
- —
- Monthly P&I
- —
- Monthly cashflow
- —
- DSCR
- —
- Eligible?
- —
No personal income docs; deal must DSCR.
Hard money
10% down · 12.0% · 12mo
- Down + closing
- —
- Monthly P&I
- —
- Monthly cashflow
- —
- DSCR
- —
- Eligible?
- —
Short-term bridge; refi at stabilization.
Listing history 38 events
-
2026-06-18days on market $574,900 Active 142 DOM
-
2026-06-17days on market $574,900 Active 141 DOM
-
2026-06-16days on market $574,900 Active 140 DOM
-
2026-06-15days on market $574,900 Active 139 DOM
-
2026-06-13days on market $574,900 Active 137 DOM
-
2026-06-13days on market $574,900 Active 136 DOM
-
2026-06-09days on market $574,900 Active 133 DOM
-
2026-06-08days on market $574,900 Active 132 DOM
-
2026-06-07days on market $574,900 Active 131 DOM
-
2026-06-04days on market $574,900 Active 128 DOM
-
2026-06-03days on market $574,900 Active 127 DOM
-
2026-06-02days on market $574,900 Active 126 DOM
-
2026-06-01days on market $574,900 Active 125 DOM
-
2026-05-31days on market $574,900 Active 124 DOM
-
2026-04-27price $574,900 232-char remark
Show marketing remark (232 chars)
Rarely available turn-key 4 plex features 3 - 2 bed units and 1 - 1 bed unit! Fully occupied and ready for its next owner. Featuring many updates throughout, this is the opportunity you've been waiting for to add to your portfolio!
-
2026-03-09price $599,900 232-char remark
Show marketing remark (232 chars)
Rarely available turn-key 4 plex features 3 - 2 bed units and 1 - 1 bed unit! Fully occupied and ready for its next owner. Featuring many updates throughout, this is the opportunity you've been waiting for to add to your portfolio!
-
2026-01-26$625,000 Active 232-char remark
Show marketing remark (232 chars)
Rarely available turn-key 4 plex features 3 - 2 bed units and 1 - 1 bed unit! Fully occupied and ready for its next owner. Featuring many updates throughout, this is the opportunity you've been waiting for to add to your portfolio!
-
2015-05-18soldstatus $265,500 Sold 254-char remark
Show marketing remark (254 chars)
Rare 4-plex in great New Hope location. Low maintenance. 3-2 BR units 1-1BR unit. Common Laundry facilities. Lots of parking. On bus line. good access to schools, shopping and transportation. Excellent opportunity for rehab & upgrades. Don't miss it.
-
2015-05-05historical 254-char remark
Show marketing remark (254 chars)
Rare 4-plex in great New Hope location. Low maintenance. 3-2 BR units 1-1BR unit. Common Laundry facilities. Lots of parking. On bus line. good access to schools, shopping and transportation. Excellent opportunity for rehab & upgrades. Don't miss it.
-
2015-05-03historical
-
2015-05-01$265,500 254-char remark
Show marketing remark (254 chars)
Rare 4-plex in great New Hope location. Low maintenance. 3-2 BR units 1-1BR unit. Common Laundry facilities. Lots of parking. On bus line. good access to schools, shopping and transportation. Excellent opportunity for rehab & upgrades. Don't miss it.
-
2015-04-22historical Contingent - Other
-
2015-04-17status Active
-
2015-03-30status Pending
-
2015-03-20historical Contingent - Other
-
2015-03-13status Active
-
2015-02-24status Pending
-
2015-02-13historical Contingent - Other
-
2015-02-04$265,500 Active
-
2006-04-18historical
-
2005-11-03$399,900
-
2004-04-23soldstatus $385,000
-
2004-03-30soldstatus $385,000
-
2004-03-15historical
-
2004-01-02$398,000
-
2003-12-22historical
-
2003-11-21$398,000
-
1983-06-01soldstatus $134,500
ⓘ Source: listings_history table (triggers on properties + properties_extension) + one-shot
backfill from property_details.listing_events for pre-trigger history.
Tax reassessment forecast MN · Partial reset (capped growth)
- Current annual tax
- $9,819 · $818/mo
- Projected year-2 tax
- $9,819 · $818/mo
- Expected delta
- $0/yr ($0/mo · 0.0%)
ⓘ Screening estimate from a state-policy table — verify with the county assessor before closing.
Climate risk First Street
- Flood 1/10 Low FEMA zone X (unshaded) · 0% chance over 30 yrs
- Wildfire 1/10 Low
- Heat 2/10 Low 7 d/yr ≥99°F today · 14 d/yr by 30 yrs out
- Wind 2/10 Low
- Air quality 2/10 Low 2 unhealthy d/yr today · 2 by 30 yrs out
Nearby sold comps map
Loading sold comps map…
Walkable amenities ~0.75 mi
Loading nearby amenities…
Taxation est. · year 1
- Rental income
- $70,404
- − Mortgage interest
- −$32,203
- − Property taxes
- −$9,819
- − Insurance
- −$2,874
- − Repairs & maintenance
- −$5,632
- − Management
- −$5,632
- − Depreciation
- −$16,724
- Taxable loss
- −$2,482
- Est. tax savings @ 24.0%
- +$596
- After-tax cash flow
- $7,343/yr
For passive investors: Depreciation is non-cash, so a rental often shows a tax loss while cash-flowing — sheltering income. Rental losses are passive: they offset passive income freely, and up to $25,000/yr can offset ordinary (W-2) income if you actively participate and your MAGI is under $100k (phasing out to $0 by $150k); unused losses carry forward. On sale, claimed depreciation is recaptured at up to 25%, and gains may owe capital-gains tax (a 1031 exchange can defer both). Figures are a year-1 estimate at your 24.0% rate — not tax advice; consult a CPA.
Schools (NCES district)
- District
- Robbinsdale Public School District
- NCES district ID
- 2731780
- Math proficiency
- 24% ▼ -11.00%
- Reading proficiency
- 44% ▼ -5.00%
- Median HH income
- $60,234
- Composite
- 30.42/100
- National rank
- #6240
- State rank
- #250 of 301 in MN
Livability — New Hope
- Score
- 86/100
- State rank
- #9
- US rank
- #345
Category grades
Schools grade is shown separately in the Schools card above.
Census & demographics
- Census place
- New Hope, MN
- County
- Hennepin County · 1,150,272 people
- City population
- 32,499
- Metro
- Minneapolis-St. Paul-Bloomington, MN-WI
- Population (ZIP)
- 24,764
- Household income
- $92,821
- Rent vs Own
- Severe rent burden
- 663.0
Population outlook (Hennepin County) Hauer SSP2
- Today (2025)
- 1,405,227 people
- By 2030
- 1,492,650 · +6.2%
- By 2040
- 1,660,157 · +18.1%
- By 2050
- 1,823,498 · +29.8%
- By 2075
- 2,221,283 · +58.1%
- By 2100
- 2,509,976 · +78.6%
Race, ethnicity, and origin ACS 2023
- Neighborhood character
- Predominantly White (70%)
- Race & ethnicity
- White 70% Black 13% Two or more races 8% Hispanic / Latino 6% Asian 4%
- Hispanic origin (detail)
- Mexican 4%
- Common ancestry
- Portuguese 12% Scottish 3% Romanian 3%
- Foreign-born
- 13% · Canada, Vietnam
- Languages at home
- 87% English-only · Spanish 5% Russian/Polish/Slavic 2% Other Indo-European 2%
Political lean MEDSL · Hennepin
- 2024 margin
- Solid D (+42.6) · D 70.2% · R 27.5% · Other 2.3%
- 2008→2024 swing
- +14.0pp toward D · 2008: 28.6pp · 2024: 42.6pp
- All cycles
- 2024: D+42.6 2020: D+43.2 2016: D+35.3 2012: D+27.1 2008: D+28.6
Not yet ingested
- Civics
- —
Market trends
- HPI YoY
- ▼ -267.55%
- Current HPI
- 235.3888
- Rent YoY
- ▲ 7.40%
- Metro
- Minneapolis-St. Paul-Bloomington, MN-WI
- State GDP YoY
- ▲ 2.41%
- F500 in state
- 34
Industry mix (Fortune 500 HQ in MN)
| Industry | F500 HQs | Revenue |
|---|---|---|
| Healthcare | 2 | $407B |
|
||
| Retail | 2 | $150B |
|
||
| Consumer Goods | 2 | $32B |
|
||
| Industrial Machinery | 2 | $6B |
|
||
| Agriculture | 1 | $40B |
|
||
| Healthcare / Medical Devices | 1 | $32B |
|
||
Price history
+327.4% since first listed24 events — show timeline
- 2026-04-27 Price Changed $574,900 NORTHSTARMLS as Distributed by MLS Grid
- 2026-03-09 Price Changed $599,900 NORTHSTARMLS as Distributed by MLS Grid
- 2026-01-26 Listed $625,000 NORTHSTARMLS as Distributed by MLS Grid
- 2015-05-18 Sold (MLS) $265,500 NORTHSTARMLS as Distributed by MLS Grid
- 2015-05-05 Listing Removed — NORTHSTARMLS as Distributed by MLS Grid
- 2015-05-03 Listing Removed — NORTHSTARMLS as Distributed by MLS Grid
- 2015-05-01 Listed $265,500 NORTHSTARMLS as Distributed by MLS Grid
- 2015-04-22 Contingent — NORTHSTARMLS as Distributed by MLS Grid
- 2015-04-17 Relisted — NORTHSTARMLS as Distributed by MLS Grid
- 2015-03-30 Pending — NORTHSTARMLS as Distributed by MLS Grid
- 2015-03-20 Contingent — NORTHSTARMLS as Distributed by MLS Grid
- 2015-03-13 Relisted — NORTHSTARMLS as Distributed by MLS Grid
- 2015-02-24 Pending — NORTHSTARMLS as Distributed by MLS Grid
- 2015-02-13 Contingent — NORTHSTARMLS as Distributed by MLS Grid
- 2015-02-04 Listed $265,500 NORTHSTARMLS as Distributed by MLS Grid
- 2006-04-18 Listing Removed — NORTHSTARMLS as Distributed by MLS Grid
- 2005-11-03 Listed $399,900 NORTHSTARMLS as Distributed by MLS Grid
- 2004-04-23 Sold (Public Records) $385,000 Public Records
- 2004-03-30 Sold (MLS) $385,000 NORTHSTARMLS as Distributed by MLS Grid
- 2004-03-15 Listing Removed — NORTHSTARMLS as Distributed by MLS Grid
- 2004-01-02 Listed $398,000 NORTHSTARMLS as Distributed by MLS Grid
- 2003-12-22 Listing Removed — NORTHSTARMLS as Distributed by MLS Grid
- 2003-11-21 Listed $398,000 NORTHSTARMLS as Distributed by MLS Grid
- 1983-06-01 Sold (Public Records) $134,500 Public Records
Property tax history
+5.8%/yrLatest (2025): $9,819 · +9.8% YoY. Source: county tax records.
Cash-flow waterfall
monthlySold comps — $/sqft
last 12 mo · ≤1 miLoading sold comps…