67278 W Chimayo Dr
Cathedral City, CA 92234
$216,000D
1 bd · 2.0 ba ·
851 sqft ·
Built 1985
· Condo
· Active
· 18 DOM
Cashflow @ list (25.0% down · 7.5%)
Estimated rent
$2,927/mo
Mortgage (P&I)
−$1,133
Tax + insurance
−$247
HOA
−$995
Vac / Maint / Mgmt
−$615
Net cashflow
$-63/mo
Annual
$-755/yr
Cap rate
5.94%
Cash-on-cash
-1.25%
DSCR
0.94
1% rule
1.35%
Cash to close
$60,480
Investor read
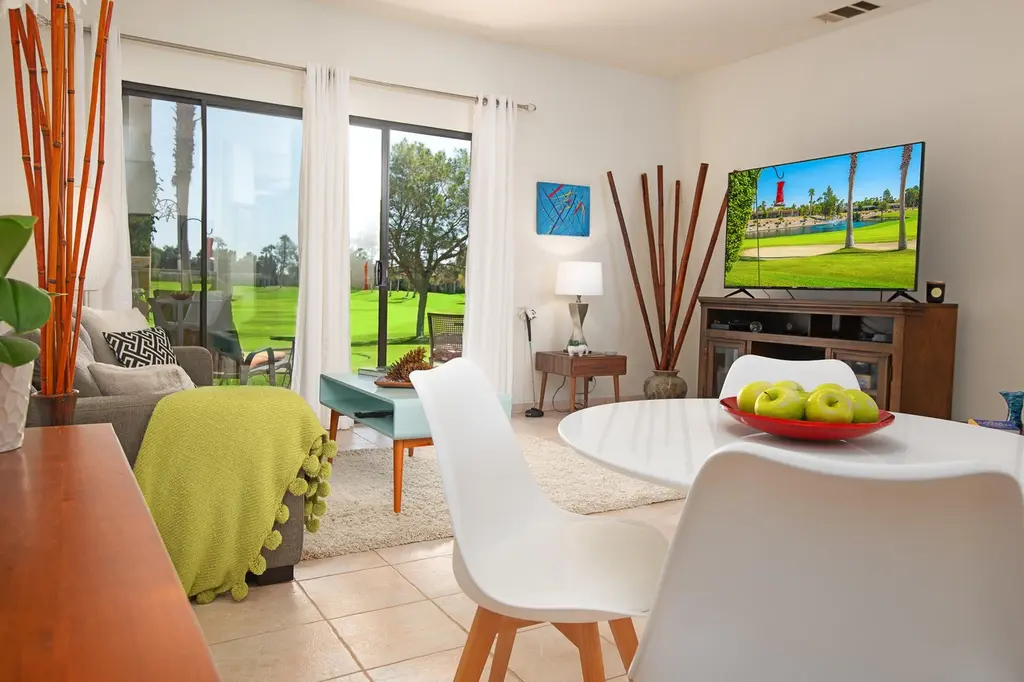
- This is a 1-bed/2.0-bath condo listed at $216k.
- At list price, monthly cash flow is $-63 ($-755/yr) — negative.
- To cash-flow at today's rent, offer at most $205k (5.1% below list).
- Meets the 1% rule at list price ($3k rent vs $216k).
- It's been on market 18 days — a 2% lower offer ($213k) is reasonable based on typical stale-listing flexibility.
- Recommended offer: $205k (5.1% below list) — sets the bar for cash-flow.
- Local home prices are declining (-3.0%/yr); year-one equity from $1k of loan paydown is wiped out by about $6k of value loss. Plan a longer hold.
- Location reads 66/100 on livability (#344 in CA) — a middle-class / working-renter tenant base. Strengths: commute A+, housing B+; Watch: employment D+, amenities D-, cost of living F.
- Palm Springs Unified (suburban): math 21% / reading 42% proficiency, ranked #328 of 517 in CA (top 63%) — families likely to look elsewhere, expect single-tenant / working-renter base with shorter leases; 73% free/reduced lunch — lower-income household profile, screen leases tightly.
- Zoned schools: Rio Vista Elementary (690 students, 96% FRL); James Workman Middle (1,028 students, 99% FRL); Cathedral City High (math 25% / reading 61%, grade F, #460 of 1,170 statewide, top 40%, 1,395 students, 98% FRL) — zoned schools average 98% FRL vs 73% district-wide (25 pts higher); higher-poverty schools than district average — tighter screening recommended.
- Watch-outs: HOA is 34% of rent.
- Market conditions: Rents rising (+3.2%/yr); 533 active listings in the ZIP; 7 comparable units currently listed for rent nearby; rentals lingering (median 46d on market — plan ~5-8 weeks vacancy on turnover, expect pricing pressure); 71% of comp listings sitting > 30 days — soft ceiling on asking rent; 9,195 units permitted in Riverside County in 2024 (1,512 in 5+ unit buildings).
- Riverside County population projected at +22% by 2050 — long-run rental-demand tailwind backs the buy-and-hold thesis.
- 8 sale attempts since 23y ago with the ask held roughly flat each time — persistent listings suggest the price (not the market) is what's stuck; bring a comps-based counter.
- Current owner paid $92k; list at $216k implies a 134% gain — meaningful room to come down on a strong offer.
- Climate carrying-cost: extreme-heat days projected 5→13/yr by 2055 (HVAC capex compounding) — expect insurance premiums to compound above CPI over the hold.
- At $2,927/mo this rent would consume 48% of the median local household income ($74k/yr) (locally 1682% of renters already pay >50% of income on rent) — very limited rent-growth headroom before tenants either downsize or default.
Questions for listing agent
- What do current leases actually rent for vs. the listed asking? Can we see a recent rent roll and the last 12 months of T-12 income?
- What does the HOA fee cover, when was the last increase, and are there any pending special assessments or reserve-fund shortfalls?
- Any open or pending special assessments — roof, HVAC, plumbing, elevator, façade? What's the per-unit balance and payoff schedule, and is the seller paying it off at close or rolling it to the buyer?
- Is there a deadline driving the sale (1031 exchange, divorce, estate, relocation)? That informs how much negotiation room exists.
- Schools are F-rated, which usually means shorter tenancies and higher turnover. Who's the typical renter profile here, and what's been the actual vacancy rate?
- The area grade is low — what's the realistic commute time and amenity access for the typical tenant pool here? Any planned neighborhood developments (good or bad) we should know about?
- This sits on a lake — are riparian / water-frontage rights deeded with the parcel? Any dock permits, shoreline easements, or HOA water-use restrictions?
- What's the documented flood / surge / shoreline-erosion history here (FEMA AND non-FEMA — e.g., storm surge, creek backup, septic-field saturation)?
CashFlowRE · CFR-4B9MD1AXBMA4ST
· Data 53 min ago
cashflowre.app · 2026-05-29