 🌊 Lakefront
67278 W Chimayo Dr · Cathedral City, CA
Flood risk 2/10 · Minimal
- FEMA flood zone
- X
- Chance of flooding over 30 yrs
- 0.09%
- Est. flood insurance / yr
- $507 – $1,088
Fire risk 1/10 · Minimal
- Est. fire insurance / yr
- $659 – $1,223
Heat risk 9/10 · Severe
- Hot days now (above 112°F)
- 5 days/yr
- Hot days in 30 yrs
- 13 days/yr
Wind risk 1/10 · Minimal
- Chance of severe wind over 30 yrs
- —
Air-quality risk 5/10 · Moderate
- Unhealthy air days now
- 6 days/yr
- Unhealthy air days in 30 yrs
- 8 days/yr
Risk factors via First Street. Map © Google.
Why this score? — see what drove the D grade
The composite is a weighted blend of 9 inputs, each scored 0–100. Each bar is that input's sub-score; the figure is the points it added to the 100-point composite (weight × sub-score).
- Cash flow +11.7/30.0
- 1% rule +8.5/10.0
- ARV discount +7.5/15.0
- DSCR +3.4/10.0
- Rent growth +3.3/5.0
- Livability +3.3/5.0
- Schools +2.7/10.0
- Condition / age +2.5/5.0
- Appreciation +0.0/10.0
$216,000
🖨 Deal sheet (PDF) 📄 Offer letter ✓ Due diligence
Listing remarks MLS
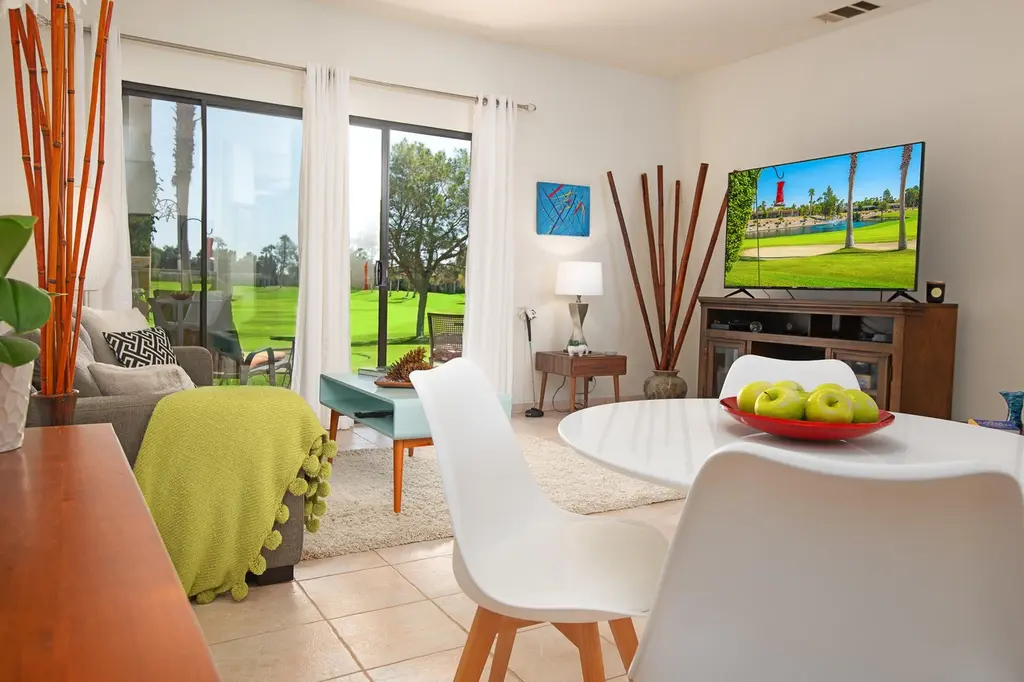
Enjoy incredible golf/lake/fountain/mountain views! Quiet, interior location! Offered turnkey furnished to include new patio furniture with gas firepit, 65 Vizio flatscreen TV in Living Rm, nice furnishings thru-out, outdoor BBQ, all appliances & more! Couch is a pull-out for overnight guests! Patios in front & back for your enjoyment! Owners have loved living here for 10 yrs! TWO Full Baths offered with 1 BR, which is a rarity! Desert Princess offers a 27-hole PGA Championship golf course and grounds that are beautifully maintained year round! HOA includes Social Membership to the club w/ 20% off food (no monthly minimums), Tennis/Pickle Ball/Bocce Ball & Fitness Membership, Cable + HBO & Showtime, Ext Insurance, Ext water, 24-hour patrol, 34 pools & spas! DPCC is conveniently located mins away from the Palm Springs Int'l airport, exciting Downtown Palm Springs full of wonderful restaurants, shopping, hiking & nightlife, Rancho Mirage & Palm Desert! Welcome to paradise!
Key facts
- Shaded patio
- Lakefront views
- Golf course views
Tags
Property features AI
Finance
- Other: All furnishings included subject to owner inventory list; some owner personal items and artwork may be removed or substituted
- Financial info: Land is lease type with annual land lease amount reported; Short-term rentals allowed; Sale may consider cash, 1031 exchange, or cash to new loan
- HOA & community: Monthly association fee ($995); HOA covers building & grounds, trash, security, maintenance, cable TV, clubhouse; Community amenities include clubhouse, fitness center, tennis, racquetball, paddle tennis, bocce, pickleball, meeting/banquet rooms, recreation room, management, guest parking, greenbelt/park, lake/pond, and golf course; Complex contains 1,206 units
Exterior
- Parking: One garage space (one total parking space, unassigned)
- Security: 24-hour security; Gated community
- Utilities: Water from local water district (CVWD); Sewer in street (paid); Cable TV available; PUD (planned unit development)
- Home design: Adobe style condominium; Attached property; Single-story (ground level, no unit above); Front door faces west; leisure area faces east
- Construction: Built per assessor records; Slab foundation
- Exterior features: Stucco exterior; Sprinkler system with timer; Lakefront and on golf course; Community has pool and in-ground heated spa; Community pool and spa (heated, in-ground)
Interior
- Kitchen: Electric range; Microwave; Refrigerator; Dishwasher; Garbage disposal
- Flooring: Tile flooring
- Bathrooms: Two full bathrooms
- Heating & cooling: Central heating; Central air conditioning
- Interior features: Turnkey (furnished); Ground-level entry with no steps; No fireplace
- Laundry & utility: Washer and dryer; 220V outlet in laundry closet
Neighborhood map
What this means for you Summary
Snapshot
- This is a 1-bed/2.0-bath condo listed at $216k.
Deal economics
- At list price, monthly cash flow is $-63 ($-755/yr) — negative.
- To cash-flow at today's rent, offer at most $205k (5.1% below list).
- Meets the 1% rule at list price ($3k rent vs $216k).
- Recommended offer: $205k (5.1% below list) — sets the bar for cash-flow.
Location & tenants
- Location reads 66/100 on livability (#344 in CA) — a middle-class / working-renter tenant base. Strengths: commute A+, housing B+; Watch: employment D+, amenities D-, cost of living F.
- Palm Springs Unified (suburban): math 21% / reading 42% proficiency, ranked #328 of 517 in CA (top 63%) — families likely to look elsewhere, expect single-tenant / working-renter base with shorter leases; 73% free/reduced lunch — lower-income household profile, screen leases tightly.
- Zoned schools: Rio Vista Elementary (690 students, 96% FRL); James Workman Middle (1,028 students, 99% FRL); Cathedral City High (math 25% / reading 61%, grade F, #460 of 1,170 statewide, top 40%, 1,395 students, 98% FRL) — zoned schools average 98% FRL vs 73% district-wide (25 pts higher); higher-poverty schools than district average — tighter screening recommended.
- Market conditions: Rents rising (+3.2%/yr); 529 active listings in the ZIP; 7 comparable units currently listed for rent nearby; rentals lingering (median 46d on market — plan ~5-8 weeks vacancy on turnover, expect pricing pressure); 71% of comp listings sitting > 30 days — soft ceiling on asking rent; 9,195 units permitted in Riverside County in 2024 (1,512 in 5+ unit buildings).
- At $2,927/mo this rent would consume 48% of the median local household income ($74k/yr) (locally 1682% of renters already pay >50% of income on rent) — very limited rent-growth headroom before tenants either downsize or default.
Forward outlook
- Local home prices are declining (-3.0%/yr); year-one equity from $1k of loan paydown is wiped out by about $6k of value loss. Plan a longer hold.
- Riverside County population projected at +22% by 2050 — long-run rental-demand tailwind backs the buy-and-hold thesis.
Negotiation context
- It's been on market 17 days — a 2% lower offer ($213k) is reasonable based on typical stale-listing flexibility.
- 8 sale attempts since 23y ago with the ask held roughly flat each time — persistent listings suggest the price (not the market) is what's stuck; bring a comps-based counter.
- Current owner paid $92k; list at $216k implies a 134% gain — meaningful room to come down on a strong offer.
Risks & watch-outs
- Watch-outs: HOA is 34% of rent.
- Climate carrying-cost: extreme-heat days projected 5→13/yr by 2055 (HVAC capex compounding) — expect insurance premiums to compound above CPI over the hold.
Questions for the listing agent
- What do current leases actually rent for vs. the listed asking? Can we see a recent rent roll and the last 12 months of T-12 income?
- What does the HOA fee cover, when was the last increase, and are there any pending special assessments or reserve-fund shortfalls?
- Any open or pending special assessments — roof, HVAC, plumbing, elevator, façade? What's the per-unit balance and payoff schedule, and is the seller paying it off at close or rolling it to the buyer?
- Is there a deadline driving the sale (1031 exchange, divorce, estate, relocation)? That informs how much negotiation room exists.
- Schools are F-rated, which usually means shorter tenancies and higher turnover. Who's the typical renter profile here, and what's been the actual vacancy rate?
- The area grade is low — what's the realistic commute time and amenity access for the typical tenant pool here? Any planned neighborhood developments (good or bad) we should know about?
- This sits on a lake — are riparian / water-frontage rights deeded with the parcel? Any dock permits, shoreline easements, or HOA water-use restrictions?
- What's the documented flood / surge / shoreline-erosion history here (FEMA AND non-FEMA — e.g., storm surge, creek backup, septic-field saturation)?
- Any water-quality or seasonal algae-bloom issues that affect tenant satisfaction or short-term-rental demand?
- What's the average days-on-market for RENTAL listings here right now (not sales)? A rising rental-DOM trend means longer vacancies and softer asking-rent achievability than the comps imply.
- What's the recent tenant-quality profile in this submarket — average credit score on applications, eviction rate, late-payment / NSF rate, and stable-employment percentage? A property-management company in the area should have these aggregated.
- How much new apartment / multifamily construction is in the pipeline within 1–3 miles? Heavy new supply (>2% of stock underway) typically softens rents 12–24 months out; light construction supports rent growth.
Investment metrics
- 1% rule
- 1.35% ✓
- Cap rate
- 5.94%
- Cash-on-cash
- -1.25%
- DSCR
- 0.94
- GRM
- 6.2
CMA / ARV
No comps found within radius.
Projected returns pro-forma
-3.0% appreciation · 3.22% rent growth · sell at horizon
- IRR
- -17.6%
- Equity multiple
- 0.38×
- Total profit
- $-37,773
- Equity at exit
- $32,206
- IRR
- -8.5%
- Equity multiple
- 0.45×
- Total profit
- $-32,995
- Equity at exit
- $18,676
Cash invested: $60,480 (down + closing). Projections, not guarantees.
Landlord ↔ Tenant lean methodology
- Overall (STATE)
- 18 Strongly Tenant-Friendly
- State California
- 18 Strongly Tenant-Friendly · D+13
- County
- — inherits STATE
- City
- — inherits STATE
ZIP-level market 92234
- Home prices YoY
- -27.7%
- Rents YoY
- 3.2%
- Active inventory
- 529
- Price-to-rent
- 6.2×
Monthly cashflow live
- Estimated rent
- $2,927 high interval (Pro) →
- Mortgage (P&I)
- −$1,133
- Tax from tax record
- −$157 /mo · $1,887/yr
- Insurance
- −$90
- HOA
- −$995
- Vacancy / Maint / Mgmt
- −$615
- Net cashflow
- $-63
Break-even live
Sensitivity live
| Price | -10% $59 | -5% $-2 | +0% $-63 | +5% $-124 | +10% $-185 |
|---|---|---|---|---|---|
| Rent | -10% $-294 | -5% $-179 | +0% $-63 | +5% $53 | +10% $168 |
| Rate | -1.0pp $46 | -0.5pp $-8 | base $-63 | +0.5pp $-119 | +1.0pp $-176 |
UW: 25.0% down · 7.5% · 30yr · 1.5% tax · 5.0% vac · 8.0% maint · 8.0% mgmt
Financing live
Cash to close
- Down payment
- $54,000
- Closing costs
- $6,480
- Reserves months
- —
- Total cash needed
- —
Loan-product check · same deal, 3 products live
Conventional
25% down · 7.5% · 30yr
- Down + closing
- —
- Monthly P&I
- —
- Monthly cashflow
- —
- DSCR
- —
- Eligible?
- —
Personal DTI + credit; lowest rate.
DSCR
20% down · 8.5% · 30yr
- Down + closing
- —
- Monthly P&I
- —
- Monthly cashflow
- —
- DSCR
- —
- Eligible?
- —
No personal income docs; deal must DSCR.
Hard money
10% down · 12.0% · 12mo
- Down + closing
- —
- Monthly P&I
- —
- Monthly cashflow
- —
- DSCR
- —
- Eligible?
- —
Short-term bridge; refi at stabilization.
Rent comps 7 comps
| Address | Beds | Baths | Sqft | Rent | $/sqft | DOM | Units | Dist |
|---|---|---|---|---|---|---|---|---|
| 67261 Cumbres Ct Cathedral City, CA | 2.0 | 2.0 | 984 | $4,000 | $4.07 | 46d | 1 | 0.15mi |
| 67240 S Chimayo Dr Unit 702 Cathedral City, CA | 1.0 | 2.0 | 851 | $2,200 | $2.59 | 46d | 1 | 0.16mi |
| 67328 Cumbres Ct Unit 702 Cathedral City, CA | 1.0 | 2.0 | 851 | $3,400 | $4.00 | 46d | 1 | 0.21mi |
| 67463 Toltec Ct Cathedral City, CA | 1.0 | 2.0 | 851 | $3,500 | $4.11 | 46d | 1 | 0.35mi |
| 28984 Desert Princess Dr Unit 702 Cathedral City, CA | 1.0 | 2.0 | 851 | $3,400 | $4.00 | 46d | 1 | 0.69mi |
| 28763 E Portales Dr Cathedral City, CA | 2.0 | 2.0 | 984 | $4,200 | $4.27 | 10d | 1 | 0.86mi |
| 68080 Risueno Rd Cathedral City, CA | 2.0 | 1.0 | 800 | $2,200 | $2.75 | 17d | 1 | 1.22mi |
HOA detail condo
- Monthly dues
- $995 · $11,940/yr
- Likely covers
- watergascablelandscapingpool
- Assessments
- None detected in remarks — confirm with the listing agent.
Listing history 11 events
-
2026-06-21days on market $216,000 Active 17 DOM
-
2026-06-18days on market $216,000 Active 14 DOM
-
2026-06-17days on market $216,000 Active 13 DOM
-
2026-06-16days on market $216,000 Active 12 DOM
-
2026-06-15days on market $216,000 Active 11 DOM
-
2026-06-13days on market $216,000 Active 9 DOM
-
2026-06-13days on market $216,000 Active 8 DOM
-
2026-06-09days on market $216,000 Active 5 DOM
-
2026-06-08days on market $216,000 Active 4 DOM
-
2026-06-07remarks 699-char remark
-
2026-06-07$216,000 Active 3 DOM
ⓘ Source: listings_history table (triggers on properties + properties_extension) + one-shot
backfill from property_details.listing_events for pre-trigger history.
Tax reassessment forecast CA · Resets to sale price
- Current annual tax
- $1,887 · $157/mo
- Projected year-2 tax
- $1,887 · $157/mo
- Expected delta
- $0/yr ($0/mo · 0.0%)
ⓘ Screening estimate from a state-policy table — verify with the county assessor before closing.
Climate risk First Street
- Flood 2/10 Low FEMA zone X · 9% chance over 30 yrs
- Wildfire 1/10 Low
- Heat 9/10 Extreme 5 d/yr ≥112°F today · 13 d/yr by 30 yrs out
- Wind 1/10 Low
- Air quality 5/10 Major 6 unhealthy d/yr today · 8 by 30 yrs out
Nearby sold comps map
Loading sold comps map…
Walkable amenities ~0.75 mi
Loading nearby amenities…
Taxation est. · year 1
- Rental income
- $35,119
- − Mortgage interest
- −$12,099
- − Property taxes
- −$1,887
- − Insurance
- −$1,080
- − Repairs & maintenance
- −$2,810
- − Management
- −$2,810
- − HOA
- −$11,940
- − Depreciation
- −$6,284
- Taxable loss
- −$3,789
- Est. tax savings @ 24.0%
- +$909
- After-tax cash flow
- $154/yr
For passive investors: Depreciation is non-cash, so a rental often shows a tax loss while cash-flowing — sheltering income. Rental losses are passive: they offset passive income freely, and up to $25,000/yr can offset ordinary (W-2) income if you actively participate and your MAGI is under $100k (phasing out to $0 by $150k); unused losses carry forward. On sale, claimed depreciation is recaptured at up to 25%, and gains may owe capital-gains tax (a 1031 exchange can defer both). Figures are a year-1 estimate at your 24.0% rate — not tax advice; consult a CPA.
Schools (NCES district)
- District
- Palm Springs Unified
- NCES district ID
- 0629550
- Math proficiency
- 21% ▼ -7.00%
- Reading proficiency
- 42% ▬ 0.00%
- Median HH income
- $43,638
- Composite
- 26.76/100
- National rank
- #7131
- State rank
- #328 of 517 in CA
Livability — Cathedral City
- Score
- 66/100
- State rank
- #344
- US rank
- #11749
Category grades
Schools grade is shown separately in the Schools card above.
Census & demographics
- Census place
- Cathedral City, CA
- County
- Riverside County · 2,287,001 people
- City population
- 52,267
- Metro
- Riverside-San Bernardino-Ontario, CA
- Population (ZIP)
- 52,267
- Household income
- $73,572
- Rent vs Own
- Severe rent burden
- 1682.0
Population outlook (Riverside County) Hauer SSP2
- Today (2025)
- 2,664,475 people
- By 2030
- 2,802,692 · +5.2%
- By 2040
- 3,050,904 · +14.5%
- By 2050
- 3,256,783 · +22.2%
- By 2075
- 3,655,058 · +37.2%
- By 2100
- 3,766,594 · +41.4%
Race, ethnicity, and origin ACS 2023
- Neighborhood character
- Diverse neighborhood (Simpson 0.56)
- Race & ethnicity
- Hispanic / Latino 59% White 30% Two or more races 27% Asian 6% Native American 2% Black 2%
- Hispanic origin (detail)
- Mexican 51%
- Common ancestry
- Lithuanian 2% Romanian 1% Italian 1%
- Foreign-born
- 28% · Canada, Vietnam
- Languages at home
- 48% English-only · Spanish 46% Tagalog/Filipino 3% Other Asian/Pacific 1%
Political lean MEDSL · Riverside
- 2024 margin
- Toss-up / Even · D 48.0% · R 49.3% · Other 2.6%
- 2008→2024 swing
- -3.6pp toward R · 2008: 2.3pp · 2024: -1.3pp
- All cycles
- 2024: R+1.3 2020: D+8.0 2016: D+4.3 2012: R+0.4 2008: D+2.3
Not yet ingested
- Civics
- —
Market trends
- HPI YoY
- ▼ -136.57%
- Current HPI
- 356.9845
- Rent YoY
- ▲ 3.22%
- Metro
- Riverside-San Bernardino-Ontario, CA
- State GDP YoY
- ▲ 3.21%
- F500 in state
- 116
Industry mix (Fortune 500 HQ in CA)
| Industry | F500 HQs | Revenue |
|---|---|---|
| Technology | 27 | $1,492B |
|
||
| Financial Services | 3 | $174B |
|
||
| Retail | 3 | $44B |
|
||
| Insurance | 3 | $26B |
|
||
| Media / Entertainment | 2 | $115B |
|
||
| Pharmaceuticals / Biotech | 2 | $62B |
|
||
Price history
+130.0% since first listed23 events — show timeline
- 2026-06-04 Listed $216,000 GPSMLS
- 2018-03-30 Sold (Public Records) $46,250 Public Records
- 2018-03-30 Sold (MLS) $92,500 GPSMLS
- 2018-03-24 Pending — GPSMLS
- 2018-01-20 Contingent — GPSMLS
- 2017-12-16 Listed $95,000 GPSMLS
- 2015-11-25 Listing Removed — GPSMLS
- 2015-11-23 Price Changed $88,000 GPSMLS
- 2015-04-18 Listed $99,000 GPSMLS
- 2008-03-06 Sold (Public Records) $125,000 Public Records
- 2008-01-31 Listing Removed — GPSMLS
- 2008-01-28 Price Changed $129,900 GPSMLS
- 2007-07-03 Listed $144,500 GPSMLS
- 2005-09-01 Sold (Public Records) $140,000 Public Records
- 2005-06-21 Sold (MLS) $140,000 GPSMLS
- 2005-04-01 Listed $145,000 GPSMLS
- 2004-02-26 Sold (MLS) $90,000 CRMLS
- 2004-02-24 Sold (MLS) $92,000 PALM
- 2004-01-17 Delisted — PALM
- 2003-12-14 Listed $93,900 PALM
- 2003-12-10 Listed $93,900 CRMLS
- 2003-12-10 Listing Removed — GPSMLS
- 2003-11-14 Listed $93,900 GPSMLS
Property tax history
-0.4%/yrLatest (2025): $1,887 · +0.3% YoY. Source: county tax records.
Cash-flow waterfall
monthlySold comps — $/sqft
last 12 mo · ≤1 miLoading sold comps…