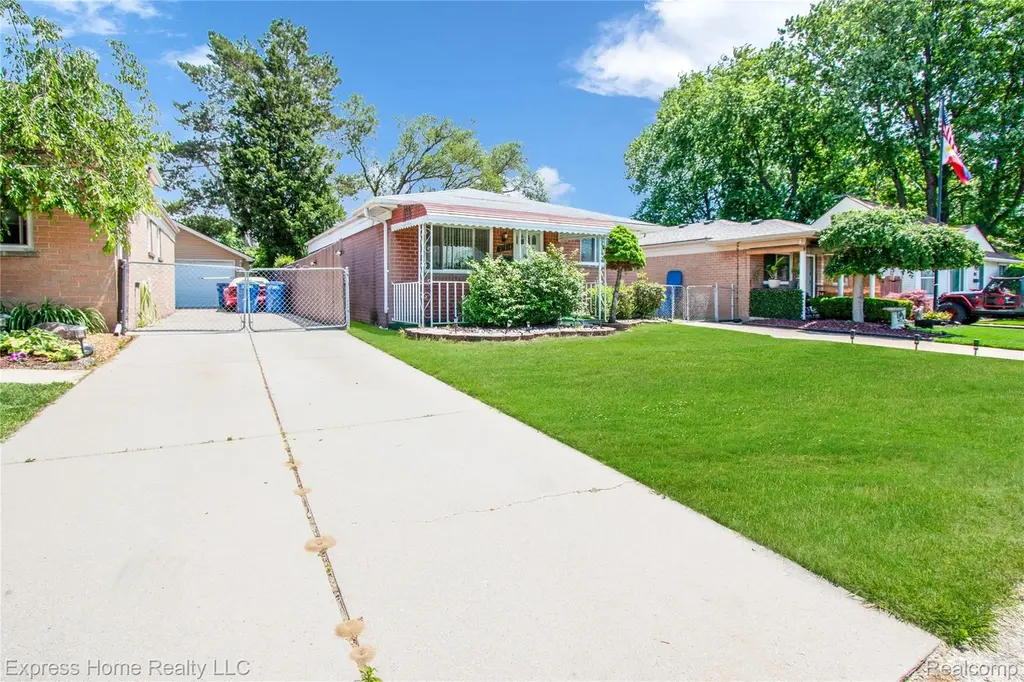
27374 Townsend Ave
Warren, MI 48092
$223,999F
3 bd · 1.0 ba ·
865 sqft ·
Built 1963
· SingleFamily
· Active
· 12 DOM
Cashflow @ list (25.0% down · 7.5%)
Estimated rent
$1,613/mo
Mortgage (P&I)
−$1,175
Tax + insurance
−$493
HOA
−$0
Vac / Maint / Mgmt
−$339
Net cashflow
$-393/mo
Annual
$-4,720/yr
Cap rate
4.19%
Cash-on-cash
-7.53%
DSCR
0.67
1% rule
0.72%
Cash to close
$62,720
Investor read
- This is a 3-bed/1.0-bath single-family listed at $224k.
- At list price, monthly cash flow is $-393 ($-5k/yr) — negative.
- To cash-flow at today's rent, offer at most $155k (31.0% below list).
- To meet the 1% rule (rent ≥ 1% of price), the offer needs to be $161k (28.0% below list).
- Only 12 days on market — expect competitive offers; lowballing is unlikely to land.
- Recommended offer: $155k (31.0% below list) — sets the bar for cash-flow.
- Local home prices are declining (-3.0%/yr); year-one equity from $2k of loan paydown is wiped out by about $7k of value loss. Plan a longer hold.
- Location reads 74/100 on livability (#171 in MI, #4,491 nationally) — a middle-class / working-renter tenant base. Strengths: commute A+, cost of living A+, housing A+; Watch: schools D, amenities D, employment D.
- Center Line Public Schools (suburban): math 14% / reading 29% proficiency, ranked #459 of 540 in MI (top 85%) — low school quality limits family demand, transient renter base, plan for 1-2y turnover; 60% free/reduced lunch — lower-income household profile, screen leases tightly.
- Market conditions: Rents rising fast (+8.0%/yr); 96 active listings in the ZIP; 6 comparable units currently listed for rent nearby; rentals lingering (median 44d on market — plan ~5-8 weeks vacancy on turnover, expect pricing pressure); 50% of comp listings sitting > 30 days — soft ceiling on asking rent; 1,321 units permitted in Macomb County in 2024 (86 in 5+ unit buildings).
- Macomb County population projected at +9% by 2050 — modest demand growth; plan on rents tracking national, not racing it.
- 12 sale attempts since 19y ago with the ask held roughly flat each time — persistent listings suggest the price (not the market) is what's stuck; bring a comps-based counter.
- Current owner paid $160k; 40% above their basis — modest negotiation headroom, anchor on the comps not their cost.
- Cap rate 4.2% vs local median 5.3% in Warren — below-typical yield; the buyer is paying a premium for something (appreciation thesis, condition, location) that the cap rate doesn't capture.
Questions for listing agent
- What do current leases actually rent for vs. the listed asking? Can we see a recent rent roll and the last 12 months of T-12 income?
- Built in 1963 — when were the roof, HVAC, electrical panel, plumbing, and water heater last replaced?
- Is there a deadline driving the sale (1031 exchange, divorce, estate, relocation)? That informs how much negotiation room exists.
- Schools are D-rated, which usually means shorter tenancies and higher turnover. Who's the typical renter profile here, and what's been the actual vacancy rate?
- Crime grade is D in this area — have there been break-ins, vandalism, or insurance claims at this property in the last 3 years? What carrier currently insures it and at what premium?
- The area grade is low — what's the realistic commute time and amenity access for the typical tenant pool here? Any planned neighborhood developments (good or bad) we should know about?
- What's the average days-on-market for RENTAL listings here right now (not sales)? A rising rental-DOM trend means longer vacancies and softer asking-rent achievability than the comps imply.
- What's the recent tenant-quality profile in this submarket — average credit score on applications, eviction rate, late-payment / NSF rate, and stable-employment percentage? A property-management company in the area should have these aggregated.
CashFlowRE · CFR-4CCN782QJYMHNA
· Data 2 days ago
cashflowre.app · 2026-05-29