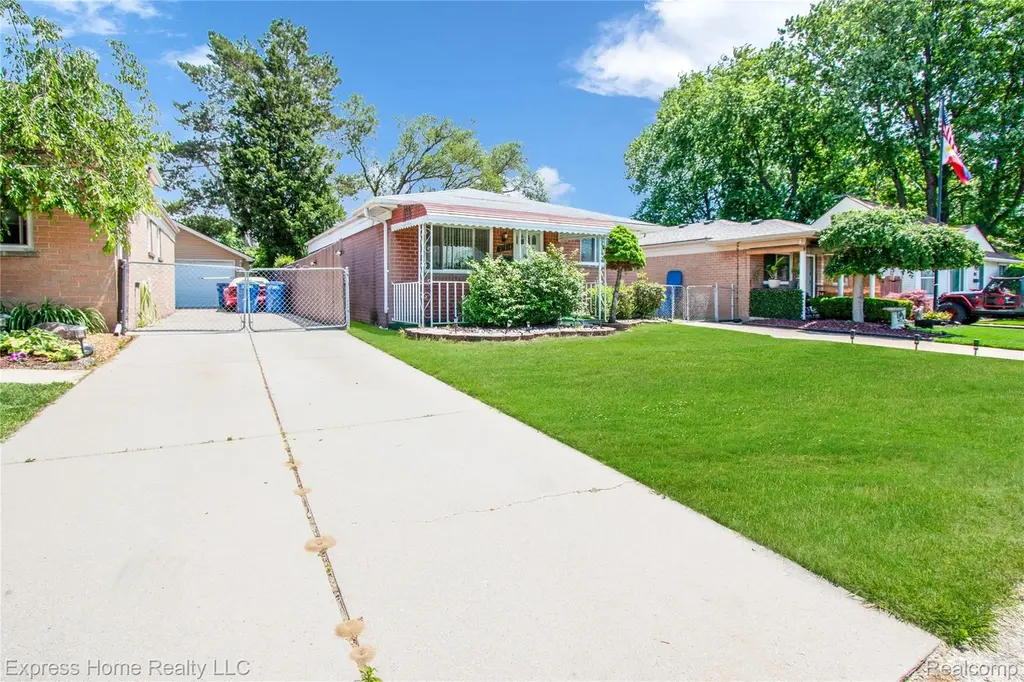
27374 Townsend Ave · Warren, MI
Flood risk 1/10 · Minimal
- FEMA flood zone
- X (unshaded)
- Chance of flooding over 30 yrs
- 0.0%
- Est. flood insurance / yr
- $473 – $860
Fire risk 1/10 · Minimal
- Est. fire insurance / yr
- $784 – $1,456
Heat risk 3/10 · Minor
- Hot days now (above 97°F)
- 7 days/yr
- Hot days in 30 yrs
- 15 days/yr
Wind risk 1/10 · Minimal
- Chance of severe wind over 30 yrs
- —
Air-quality risk 3/10 · Minor
- Unhealthy air days now
- 3 days/yr
- Unhealthy air days in 30 yrs
- 4 days/yr
Risk factors via First Street. Map © Google.
Why this score? — see what drove the F grade
The composite is a weighted blend of 9 inputs, each scored 0–100. Each bar is that input's sub-score; the figure is the points it added to the 100-point composite (weight × sub-score).
- ARV discount +7.5/15.0
- Cash flow +6.3/30.0
- Rent growth +4.5/5.0
- Livability +3.7/5.0
- Condition / age +2.5/5.0
- 1% rule +2.2/10.0
- Schools +1.8/10.0
- DSCR +0.7/10.0
- Appreciation +0.0/10.0
$223,999
🖨 Deal sheet 📄 Offer letter ✓ Due diligence
Listing remarks MLS
Welcome to this charming Warren ranch offering 3 bedrooms, 1.5 bathrooms, and a finished basement. This well-maintained home features a spacious living area, an updated kitchen, and plenty of natural light throughout. The finished basement provides additional living and entertaining space, while the detached garage and private backyard add convenience and outdoor enjoyment. Located near schools, shopping, dining, and major highways, this home is a great opportunity for first-time buyers, downsizers, or investors. Schedule your showing today!
Key facts
- Private backyard
- Finished basement
- Updated kitchen
Tags
Property features AI
Finance
- Other: Residential property in SUMERACKIS VAN DYKE subdivision
Exterior
- Parking: Detached 2-car garage
- Utilities: Public water; Public sewer
- Home design: Single-family residence; One level above grade; Ground-level entry
- Construction: Brick construction; Brick/mortar foundation; Built with a shingle roof not specified
- Exterior features: Private maintained road; Private road frontage; Lot dimensions approximately 40 x 110 (0.1 acre)
Interior
- Kitchen: No specific kitchen appliance details provided
- Bedrooms: 3 total rooms (includes bedrooms and living space)
- Bathrooms: 1 full bathroom; 1 half bathroom
- Heating & cooling: Forced air heating; Natural gas heating; No cooling
- Interior features: Finished full basement
- Laundry & utility: Has heating
Neighborhood map
What this means for you Summary
Snapshot
- This is a 3-bed/1.0-bath single-family listed at $224k.
Deal economics
- At list price, monthly cash flow is $-393 ($-5k/yr) — negative.
- To cash-flow at today's rent, offer at most $155k (31.0% below list).
- To meet the 1% rule (rent ≥ 1% of price), the offer needs to be $161k (28.0% below list).
- Recommended offer: $155k (31.0% below list) — sets the bar for cash-flow.
- Cap rate 4.2% vs local median 5.3% in Warren — below-typical yield; the buyer is paying a premium for something (appreciation thesis, condition, location) that the cap rate doesn't capture.
Location & tenants
- Location reads 74/100 on livability (#171 in MI, #4,491 nationally) — a middle-class / working-renter tenant base. Strengths: commute A+, cost of living A+, housing A+; Watch: schools D, amenities D, employment D.
- Center Line Public Schools (suburban): math 14% / reading 29% proficiency, ranked #459 of 540 in MI (top 85%) — low school quality limits family demand, transient renter base, plan for 1-2y turnover; 60% free/reduced lunch — lower-income household profile, screen leases tightly.
- Market conditions: Rents rising fast (+8.0%/yr); 96 active listings in the ZIP; 6 comparable units currently listed for rent nearby; rentals lingering (median 44d on market — plan ~5-8 weeks vacancy on turnover, expect pricing pressure); 50% of comp listings sitting > 30 days — soft ceiling on asking rent; 1,321 units permitted in Macomb County in 2024 (86 in 5+ unit buildings).
Forward outlook
- Local home prices are declining (-3.0%/yr); year-one equity from $2k of loan paydown is wiped out by about $7k of value loss. Plan a longer hold.
- Macomb County population projected at +9% by 2050 — modest demand growth; plan on rents tracking national, not racing it.
Negotiation context
- Only 12 days on market — expect competitive offers; lowballing is unlikely to land.
- 12 sale attempts since 19y ago with the ask held roughly flat each time — persistent listings suggest the price (not the market) is what's stuck; bring a comps-based counter.
- Current owner paid $160k; 40% above their basis — modest negotiation headroom, anchor on the comps not their cost.
Questions for the listing agent
- What do current leases actually rent for vs. the listed asking? Can we see a recent rent roll and the last 12 months of T-12 income?
- Built in 1963 — when were the roof, HVAC, electrical panel, plumbing, and water heater last replaced?
- Is there a deadline driving the sale (1031 exchange, divorce, estate, relocation)? That informs how much negotiation room exists.
- Schools are D-rated, which usually means shorter tenancies and higher turnover. Who's the typical renter profile here, and what's been the actual vacancy rate?
- Crime grade is D in this area — have there been break-ins, vandalism, or insurance claims at this property in the last 3 years? What carrier currently insures it and at what premium?
- The area grade is low — what's the realistic commute time and amenity access for the typical tenant pool here? Any planned neighborhood developments (good or bad) we should know about?
- What's the average days-on-market for RENTAL listings here right now (not sales)? A rising rental-DOM trend means longer vacancies and softer asking-rent achievability than the comps imply.
- What's the recent tenant-quality profile in this submarket — average credit score on applications, eviction rate, late-payment / NSF rate, and stable-employment percentage? A property-management company in the area should have these aggregated.
- How much new for-sale + rental construction is in the pipeline within 1–3 miles? Heavy new supply typically softens prices + rents 12–24 months out; constrained supply supports both.
Investment metrics
- 1% rule
- 0.72% ✗
- Cap rate
- 4.19%
- Cash-on-cash
- -7.53%
- DSCR
- 0.67
- GRM
- 11.6
CMA / ARV
- ARV (on-the-fly)
- $147,915
- Comps found
- 12
Show comp detail 12 sales within ~0.75 mi
| Address | Dist | Beds/Ba | Sqft | Sold | Price | $/sf | Match |
|---|---|---|---|---|---|---|---|
| 27390 Seyburn Ave | 0.11mi | 3/1.0 | 900 (+4%) | 2mo | $167,000 | $186 | 87 |
| 27210 Seyburn Ave | 0.13mi | 3/1.0 | 952 (+10%) | 0mo | $162,000 | $170 | 77 |
| 27034 Baldwin Ave | 0.17mi | 3/1.0 | 912 (+5%) | 9mo | $155,000 | $170 | 75 |
| 27263 Arsenal Ave | 0.43mi | 3/1.0 | 884 (+2%) | 8mo | $225,000 | $255 | 70 |
| 27128 Baldwin Ave | 0.12mi | 3/1.0 | 948 (+10%) | 13mo | $145,000 | $153 | 68 |
| 7377 Bernice | 0.45mi | 2/1.0 (-1) | 816 (-6%) | 2mo | $105,000 | $129 | 63 |
| 8443 Hettenberger Ave | 0.52mi | 3/1.0 | 865 (0%) | 16mo | $182,000 | $210 | 63 |
| 8412 Farnum Ave | 0.47mi | 3/1.0 | 912 (+5%) | 15mo | $177,000 | $194 | 57 |
| 7431 Anna Ave | 0.67mi | 3/1.0 | 912 (+5%) | 13mo | $167,000 | $183 | 49 |
| 7567 Marian St | 0.73mi | 3/1.5 | 924 (+7%) | 18mo | $158,000 | $171 | 38 |
| 8073 Helen | 0.74mi | 2/1.0 (-1) | 993 (+15%) | 8mo | $160,000 | $161 | 29 |
| 7549 Anna Ave | 0.67mi | 3/1.0 | 993 (+15%) | 18mo | $170,000 | $171 | 29 |
Match score weights: distance 35% · size 25% · config 20% · recency 20%. Top-matched comps best support the ARV.
Projected returns pro-forma
-3.0% appreciation · 8.0% rent growth · sell at horizon
- IRR
- -23.5%
- Equity multiple
- 0.16×
- Total profit
- $-52,729
- Equity at exit
- $33,399
- IRR
- -8.1%
- Equity multiple
- 0.38×
- Total profit
- $-38,982
- Equity at exit
- $19,367
Cash invested: $62,720 (down + closing). Projections, not guarantees.
Landlord ↔ Tenant lean methodology
- Overall (STATE)
- 62 Landlord-Friendly
- State Michigan
- 62 Landlord-Friendly · EVEN
- County
- — inherits STATE
- City
- — inherits STATE
ZIP-level market 48092
- Rents YoY
- 8.0%
- Active inventory
- 96
- Price-to-rent
- 11.6×
Monthly cashflow live
- Estimated rent
- $1,613 high interval (Pro) →
- Mortgage (P&I)
- −$1,175
- Tax from tax record
- −$400 /mo · $4,795/yr
- Insurance
- −$93
- HOA
- −$0
- Vacancy / Maint / Mgmt
- −$339
- Net cashflow
- $-393
Break-even live
UW: 25.0% down · 7.5% · 30yr · 1.5% tax · 5.0% vac · 8.0% maint · 8.0% mgmt
Financing live
Cash to close
- Down payment
- $56,000
- Closing costs
- $6,720
- Reserves months
- —
- Total cash needed
- —
Loan-product check · same deal, 3 products live
Conventional
25% down · 7.5% · 30yr
- Down + closing
- —
- Monthly P&I
- —
- Monthly cashflow
- —
- DSCR
- —
- Eligible?
- —
Personal DTI + credit; lowest rate.
DSCR
20% down · 8.5% · 30yr
- Down + closing
- —
- Monthly P&I
- —
- Monthly cashflow
- —
- DSCR
- —
- Eligible?
- —
No personal income docs; deal must DSCR.
Hard money
10% down · 12.0% · 12mo
- Down + closing
- —
- Monthly P&I
- —
- Monthly cashflow
- —
- DSCR
- —
- Eligible?
- —
Short-term bridge; refi at stabilization.
Rent comps 6 comps
| Address | Beds | Baths | Sqft | Rent | $/sqft | DOM | Units | Dist |
|---|---|---|---|---|---|---|---|---|
| 27107 Seyburn Ave Warren, MI | 2.0 | 1.0 | 750 | $1,300 | $1.73 | 22d | 1 | 0.18mi |
| 29250 Longview Ave Apt 14 Warren, MI | 2.0 | 1.0 | 950 | $1,000 | $1.05 | 43d | 1 | 1.04mi |
| 29400 Towne Center Cir Warren, MI | 1.0–3.0 | 1.0–2.0 | 1114 | $2,099 | $1.88 | 1d | 1 | 1.11mi |
| 25005 Lawrence Ave Center Line, MI | 1.0–2.0 | 1.0–1.5 | 1000 | $955 | $0.95 | 43d | 1 | 1.19mi |
| 27239 Hoover Rd Warren, MI | 1.0–2.0 | 1.0 | 670 | $945 | $1.41 | 43d | 1 | 1.22mi |
| 28250 Hoover Rd Warren, MI | 1.0–2.0 | 1.0–2.0 | 912 | $1,705 | $1.87 | 2d | 17 | 1.42mi |
Listing history 9 events
-
2026-06-18days on market $223,999 Active 12 DOM
-
2026-06-17days on market $223,999 Active 11 DOM
-
2026-06-16days on market $223,999 Active 10 DOM
-
2026-06-15days on market $223,999 Active 9 DOM
-
2026-06-13pricedays on market $223,999 Active 7 DOM
-
2026-06-09days on market $224,999 Active 3 DOM
-
2026-06-08days on market $224,999 Active 2 DOM
-
2026-06-07remarks 547-char remark
-
2026-06-07$224,999 Active 1 DOM
ⓘ Source: listings_history table (triggers on properties + properties_extension) + one-shot
backfill from property_details.listing_events for pre-trigger history.
Tax reassessment forecast MI · Partial reset (capped growth)
- Current annual tax
- $4,795 · $400/mo
- Projected year-2 tax
- $4,795 · $400/mo
- Expected delta
- $0/yr ($0/mo · 0.0%)
ⓘ Screening estimate from a state-policy table — verify with the county assessor before closing.
Climate risk First Street
- Flood 1/10 Low FEMA zone X (unshaded) · 0% chance over 30 yrs
- Wildfire 1/10 Low
- Heat 3/10 Moderate 7 d/yr ≥97°F today · 15 d/yr by 30 yrs out
- Wind 1/10 Low
- Air quality 3/10 Moderate 3 unhealthy d/yr today · 4 by 30 yrs out
Nearby sold comps map
Loading sold comps map…
Walkable amenities ~0.75 mi
Loading nearby amenities…
Taxation est. · year 1
- Rental income
- $19,356
- − Mortgage interest
- −$12,547
- − Property taxes
- −$4,795
- − Insurance
- −$1,120
- − Repairs & maintenance
- −$1,548
- − Management
- −$1,548
- − Depreciation
- −$6,516
- Taxable loss
- −$8,720
- Est. tax savings @ 24.0%
- +$2,093
- After-tax cash flow
- $-2,628/yr
For passive investors: Depreciation is non-cash, so a rental often shows a tax loss while cash-flowing — sheltering income. Rental losses are passive: they offset passive income freely, and up to $25,000/yr can offset ordinary (W-2) income if you actively participate and your MAGI is under $100k (phasing out to $0 by $150k); unused losses carry forward. On sale, claimed depreciation is recaptured at up to 25%, and gains may owe capital-gains tax (a 1031 exchange can defer both). Figures are a year-1 estimate at your 24.0% rate — not tax advice; consult a CPA.
Schools (NCES district)
- District
- Center Line Public Schools
- NCES district ID
- 2608580
- Math proficiency
- 14% ▼ -8.00%
- Reading proficiency
- 29% ▼ -3.00%
- Median HH income
- $38,011
- Composite
- 17.95/100
- National rank
- #8992
- State rank
- #459 of 540 in MI
Livability — Warren
- Score
- 74/100
- State rank
- #171
- US rank
- #4491
Category grades
Schools grade is shown separately in the Schools card above.
Census & demographics
- Census place
- Warren, MI
- County
- Macomb County · 638,552 people
- City population
- 114,937
- Metro
- Detroit-Warren-Dearborn, MI
- Population (ZIP)
- 27,374
- Household income
- $73,808
- Rent vs Own
- Severe rent burden
- 675.0
Population outlook (Macomb County) Hauer SSP2
- Today (2025)
- 925,296 people
- By 2030
- 948,226 · +2.5%
- By 2040
- 983,961 · +6.3%
- By 2050
- 1,010,200 · +9.2%
- By 2075
- 1,076,222 · +16.3%
- By 2100
- 1,077,065 · +16.4%
Race, ethnicity, and origin ACS 2023
- Neighborhood character
- Diverse neighborhood (Simpson 0.55)
- Race & ethnicity
- White 63% Asian 17% Black 14% Two or more races 4% Hispanic / Latino 2%
- Common ancestry
- Romanian 10% Arab 4% Subsaharan African 2%
- Foreign-born
- 22% · Vietnam, Canada, China
- Languages at home
- 70% English-only · Other Indo-European 11% Arabic 5% Russian/Polish/Slavic 3%
Political lean MEDSL · Macomb
- 2024 margin
- R (+13.7) · D 42.2% · R 55.9% · Other 1.9%
- 2008→2024 swing
- -22.3pp toward R · 2008: 8.6pp · 2024: -13.7pp
- All cycles
- 2024: R+13.7 2020: R+8.1 2016: R+11.6 2012: D+4.0 2008: D+8.6
Not yet ingested
- Civics
- —
Market trends
- HPI YoY
- ▼ -262.85%
- Current HPI
- 189.7524
- Rent YoY
- ▲ 8.03%
- Metro
- Detroit-Warren-Dearborn, MI
- State GDP YoY
- ▲ 1.37%
- F500 in state
- 28
Industry mix (Fortune 500 HQ in MI)
| Industry | F500 HQs | Revenue |
|---|---|---|
| Automotive Parts | 3 | $48B |
|
||
| Automotive | 2 | $372B |
|
||
| Chemicals | 1 | $45B |
|
||
| Automotive Retail | 1 | $29B |
|
||
| Healthcare / Medical Devices | 1 | $23B |
|
||
| Automotive Technology | 1 | $20B |
|
||
Price history
+298.2% since first listed35 events — show timeline
- 2026-06-06 Listed $224,999 REALCOMP
- 2026-06-06 Listed $224,999 MiRealSource-MiMLS
- 2023-02-15 Pending — REALCOMP
- 2023-02-14 Sold (Public Records) $160,000 Public Records
- 2023-02-10 Sold (MLS) $160,000 MiRealSource-MiMLS
- 2023-02-10 Sold (MLS) $160,000 REALCOMP
- 2023-01-19 Listing Removed — MiRealSource-MiMLS
- 2022-12-13 Contingent — MiRealSource-MiMLS
- 2022-12-13 Contingent — REALCOMP
- 2022-11-18 Price Changed $162,000 MiRealSource-MiMLS
- 2022-11-18 Price Changed $162,000 REALCOMP
- 2022-10-21 Listed $170,000 MiRealSource-MiMLS
- 2022-10-21 Listed $170,000 REALCOMP
- 2022-08-03 Sold (Public Records) $135,500 Public Records
- 2022-07-22 Sold (MLS) $135,500 MiRealSource-MiMLS
- 2022-07-22 Sold (MLS) $135,500 REALCOMP
- 2022-07-16 Pending — MiRealSource-MiMLS
- 2022-07-16 Pending — REALCOMP
- 2022-07-12 Listed $124,900 MiRealSource-MiMLS
- 2022-07-12 Listed $124,900 REALCOMP
- 2019-05-22 Listing Removed — REALCOMP
- 2019-05-22 Listing Removed — MiRealSource-MiMLS
- 2018-11-01 Listed $114,900 MiRealSource-MiMLS
- 2018-11-01 Listed $114,900 REALCOMP
- 2018-11-01 Listing Removed — REALCOMP
- 2018-10-31 Listing Removed — MiRealSource-MiMLS
- 2018-02-21 Listed $114,900 MiRealSource-MiMLS
- 2018-02-21 Listed $114,900 REALCOMP
- 2007-09-25 Sold (Public Records) $110,000 Public Records
- 2007-08-29 Sold (MLS) $110,000 MiRealSource-MiMLS
- 2007-08-29 Sold (MLS) $110,000 REALCOMP
- 2007-07-27 Listing Removed — MiRealSource-MiMLS
- 2007-07-05 Listed $112,985 MiRealSource-MiMLS
- 2007-07-05 Listed $112,985 REALCOMP
- 1989-09-07 Sold (Public Records) $56,500 Public Records
Property tax history
+8.7%/yrLatest (2025): $4,795 · +1.7% YoY. Source: county tax records.
Cash-flow waterfall
monthlySold comps — $/sqft
last 12 mo · ≤1 miLoading sold comps…