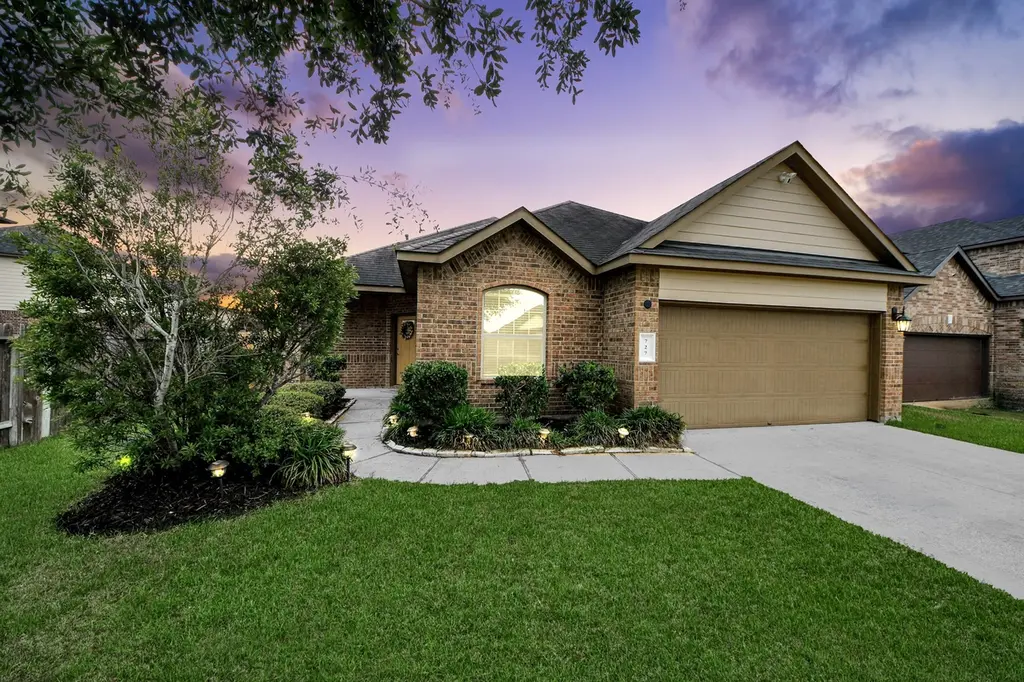
727 Mill Spring Ct
Rosenberg, TX 77469
$313,750D+
4 bd · 2.0 ba ·
2,053 sqft ·
Built 2015
· SingleFamily
· Active
· 6 DOM
Cashflow @ list (25.0% down · 7.5%)
Estimated rent
$3,313/mo
Mortgage (P&I)
−$1,645
Tax + insurance
−$775
HOA
−$69
Vac / Maint / Mgmt
−$696
Net cashflow
$128/mo
Annual
$1,536/yr
Cap rate
6.78%
Cash-on-cash
1.75%
DSCR
1.08
1% rule
1.06%
Cash to close
$87,850
Investor read
- This is a 4-bed/2.0-bath single-family listed at $314k.
- At list price, monthly cash flow is $128 ($2k/yr) — positive.
- The deal already cash-flows at list — no discount required.
- Meets the 1% rule at list price ($3k rent vs $314k).
- Only 6 days on market — expect competitive offers; lowballing is unlikely to land.
- Local home prices are declining (-3.0%/yr); year-one equity from $2k of loan paydown is wiped out by about $9k of value loss. Plan a longer hold.
- Location reads 62/100 on livability (#922 in TX) — a middle-class / working-renter tenant base. Strengths: cost of living A+, housing A+, crime B; Watch: amenities F, commute F, health & safety F.
- Lamar CISD (suburban): math 50% / reading 53% proficiency, ranked #116 of 826 in TX (top 14%) — acceptable for families but not a draw, mixed tenant base, ~2y average lease.
- Zoned schools: George Ranch H S (math 52% / reading 76%, grade B-, #224 of 1,632 statewide, top 14%, 2,511 students, 27% FRL) — zoned schools average 27% FRL vs 43% district-wide (15 pts lower); this property's tenant base skews higher-income than the district average.
- Zoned-school proficiency averages 64% at this address vs 52% district-wide (+12 pts) — the actual schools serving this property are materially stronger than the Lamar CISD average implies; a family-tenant draw the district grade alone would hide.
- Market conditions: Rents soft (-1.8%/yr); 1332 active listings in the ZIP; 2 comparable units currently listed for rent nearby; solid renter incomes; 12,093 units permitted in Fort Bend County in 2024 (815 in 5+ unit buildings).
- Fort Bend County population projected at +75% by 2050 — long-run rental-demand tailwind backs the buy-and-hold thesis.
- 2 sale attempts with the ask held roughly flat each time — persistent listings suggest the price (not the market) is what's stuck; bring a comps-based counter.
- Climate carrying-cost: severe wind risk, 99% chance of damaging wind over 30y; extreme-heat days projected 7→24/yr by 2055 (HVAC capex compounding) — expect insurance premiums to compound above CPI over the hold.
- Cap rate 6.8% vs local median 3.4% in Rosenberg — top-decile yield for the area; either an underpriced asset or a hidden risk that comps aren't pricing in. Stress-test before assuming the spread holds.
- This rent runs 39% of the median local income ($102k/yr) — at the standard rent-burdened threshold; future hikes will face affordability resistance.
Questions for listing agent
- What does the HOA fee cover, when was the last increase, and are there any pending special assessments or reserve-fund shortfalls?
- Is there a deadline driving the sale (1031 exchange, divorce, estate, relocation)? That informs how much negotiation room exists.
- Schools are D-rated, which usually means shorter tenancies and higher turnover. Who's the typical renter profile here, and what's been the actual vacancy rate?
- The area grade is low — what's the realistic commute time and amenity access for the typical tenant pool here? Any planned neighborhood developments (good or bad) we should know about?
- What's the average days-on-market for RENTAL listings here right now (not sales)? A rising rental-DOM trend means longer vacancies and softer asking-rent achievability than the comps imply.
- What's the recent tenant-quality profile in this submarket — average credit score on applications, eviction rate, late-payment / NSF rate, and stable-employment percentage? A property-management company in the area should have these aggregated.
- How much new for-sale + rental construction is in the pipeline within 1–3 miles? Heavy new supply typically softens prices + rents 12–24 months out; constrained supply supports both.
CashFlowRE · CFR-4DYMP6C40YWTCR
· Data 2 days ago
cashflowre.app · 2026-05-29