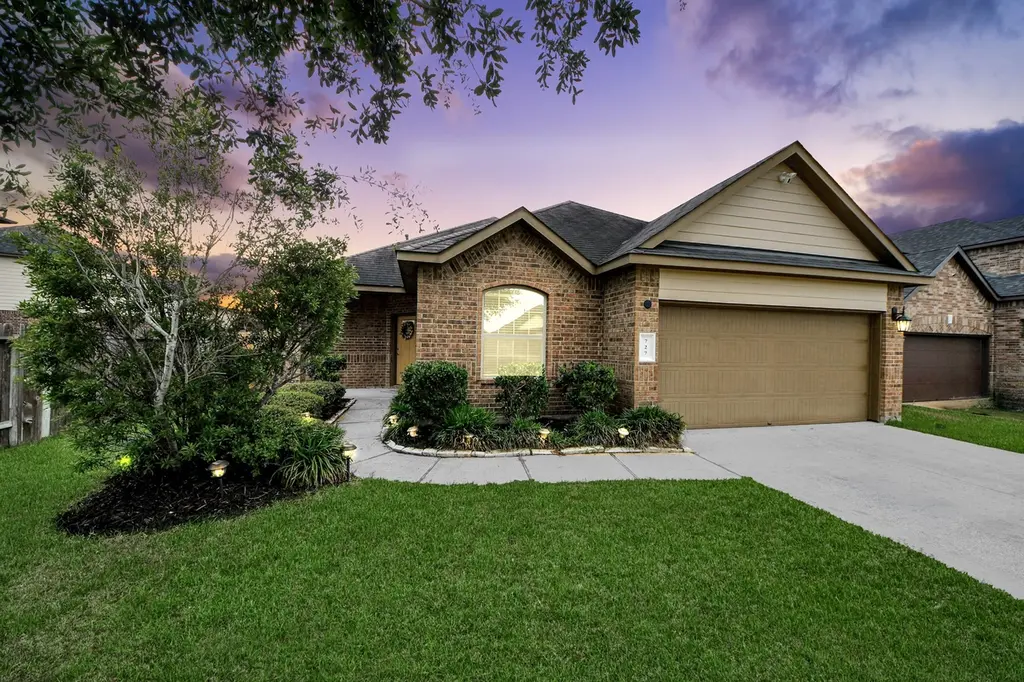
727 Mill Spring Ct · Rosenberg, TX
Flood risk 1/10 · Minimal
- FEMA flood zone
- X (unshaded)
- Chance of flooding over 30 yrs
- 0.0%
- Est. flood insurance / yr
- $507 – $1,088
Fire risk 1/10 · Minimal
- Est. fire insurance / yr
- $1,222 – $2,270
Heat risk 9/10 · Severe
- Hot days now (above 111°F)
- 7 days/yr
- Hot days in 30 yrs
- 24 days/yr
Wind risk 9/10 · Severe
- Chance of severe wind over 30 yrs
- 99.0%
Air-quality risk 2/10 · Minimal
- Unhealthy air days now
- 1 days/yr
- Unhealthy air days in 30 yrs
- 1 days/yr
Risk factors via First Street. Map © Google.
Why this score? — see what drove the D+ grade
The composite is a weighted blend of 9 inputs, each scored 0–100. Each bar is that input's sub-score; the figure is the points it added to the 100-point composite (weight × sub-score).
- Cash flow +15.5/30.0
- ARV discount +9.7/15.0
- 1% rule +5.6/10.0
- DSCR +4.8/10.0
- Schools +4.6/10.0
- Livability +3.1/5.0
- Condition / age +2.5/5.0
- Rent growth +2.0/5.0
- Appreciation +0.0/10.0
$313,750
🖨 Deal sheet 📄 Offer letter ✓ Due diligence
Listing remarks
Welcome home to this beautifully maintained 4-bedroom, 2-bath residence, ideally situated on a quiet street in the highly desirable Bonbrook community. Boasting 2,053 sq ft of move-in-ready living space, this home offers the perfect blend of comfort, style, and everyday functionality. Step inside through a brand-new front door and be greeted by a versatile layout, including a flex space ideal for a home office, formal dining, or creative use to fit your lifestyle. The all-brick exterior provides timeless curb appeal and lasting durability, while the spacious backyard creates the perfect setting for entertaining, relaxing, or enjoying outdoor living with sprinkler system. Enjoy access to Bon
Key facts
- Spacious backyard
- Clubhouse
- Community pool
Tags
Property features AI
Finance
- Other: Seller disclosure available
- HOA & community: Homeowners association: Streling ASI; Annual association fee of $825
Exterior
- Parking: Attached 2-car garage
- Security: Prewired for security; Smoke detectors
- Utilities: Public water; Public sewer
- Home design: Residential property; Single-story (all main living areas on first floor); Slab foundation
- Construction: Brick construction; Built in 2015; Composition roof
- Exterior features: Fenced backyard; Sprinkler / irrigation system; Located in a subdivision
Interior
- Kitchen: Dishwasher; Garbage disposal; Microwave; Breakfast bar
- Bedrooms: Primary bedroom (first floor) — 14x13; Bedroom (first floor) — 11x10; Bedroom (first floor) — 11x10; Bedroom (first floor) — 11x10; Den (first floor); Office (first floor)
- Flooring: Carpet; Tile
- Bathrooms: 2 full bathrooms; Features include double vanity, soaking tub, separate shower, and tub/shower
- Heating & cooling: Central heating (electric and gas); Central air conditioning (electric)
- Interior features: Breakfast bar; Crown molding; Double vanity; Self-closing cabinet doors and drawers; Soaking tub; Separate shower; Tub/shower combo; Ceiling fans; Programmable thermostat; Low emissivity (energy-efficient) windows
- Laundry & utility: Washer hookup; Electric dryer hookup; Gas dryer hookup; Utility room (first floor)
Neighborhood map
What this means for you Summary
Snapshot
- This is a 4-bed/2.0-bath single-family listed at $314k.
Deal economics
- At list price, monthly cash flow is $128 ($2k/yr) — positive.
- The deal already cash-flows at list — no discount required.
- Meets the 1% rule at list price ($3k rent vs $314k).
- Cap rate 6.8% vs local median 3.4% in Rosenberg — top-decile yield for the area; either an underpriced asset or a hidden risk that comps aren't pricing in. Stress-test before assuming the spread holds.
Location & tenants
- Location reads 62/100 on livability (#922 in TX) — a middle-class / working-renter tenant base. Strengths: cost of living A+, housing A+, crime B; Watch: amenities F, commute F, health & safety F.
- Lamar CISD (suburban): math 50% / reading 53% proficiency, ranked #116 of 826 in TX (top 14%) — acceptable for families but not a draw, mixed tenant base, ~2y average lease.
- Zoned schools: George Ranch H S (math 52% / reading 76%, grade B-, #224 of 1,632 statewide, top 14%, 2,511 students, 27% FRL) — zoned schools average 27% FRL vs 43% district-wide (15 pts lower); this property's tenant base skews higher-income than the district average.
- Zoned-school proficiency averages 64% at this address vs 52% district-wide (+12 pts) — the actual schools serving this property are materially stronger than the Lamar CISD average implies; a family-tenant draw the district grade alone would hide.
- Market conditions: Rents soft (-1.8%/yr); 1332 active listings in the ZIP; 2 comparable units currently listed for rent nearby; solid renter incomes; 12,093 units permitted in Fort Bend County in 2024 (815 in 5+ unit buildings).
- This rent runs 39% of the median local income ($102k/yr) — at the standard rent-burdened threshold; future hikes will face affordability resistance.
Forward outlook
- Local home prices are declining (-3.0%/yr); year-one equity from $2k of loan paydown is wiped out by about $9k of value loss. Plan a longer hold.
- Fort Bend County population projected at +75% by 2050 — long-run rental-demand tailwind backs the buy-and-hold thesis.
Negotiation context
- Only 6 days on market — expect competitive offers; lowballing is unlikely to land.
- 2 sale attempts with the ask held roughly flat each time — persistent listings suggest the price (not the market) is what's stuck; bring a comps-based counter.
Risks & watch-outs
- Climate carrying-cost: severe wind risk, 99% chance of damaging wind over 30y; extreme-heat days projected 7→24/yr by 2055 (HVAC capex compounding) — expect insurance premiums to compound above CPI over the hold.
Questions for the listing agent
- What does the HOA fee cover, when was the last increase, and are there any pending special assessments or reserve-fund shortfalls?
- Is there a deadline driving the sale (1031 exchange, divorce, estate, relocation)? That informs how much negotiation room exists.
- Schools are D-rated, which usually means shorter tenancies and higher turnover. Who's the typical renter profile here, and what's been the actual vacancy rate?
- The area grade is low — what's the realistic commute time and amenity access for the typical tenant pool here? Any planned neighborhood developments (good or bad) we should know about?
- What's the average days-on-market for RENTAL listings here right now (not sales)? A rising rental-DOM trend means longer vacancies and softer asking-rent achievability than the comps imply.
- What's the recent tenant-quality profile in this submarket — average credit score on applications, eviction rate, late-payment / NSF rate, and stable-employment percentage? A property-management company in the area should have these aggregated.
- How much new for-sale + rental construction is in the pipeline within 1–3 miles? Heavy new supply typically softens prices + rents 12–24 months out; constrained supply supports both.
Investment metrics
- 1% rule
- 1.06% ✓
- Cap rate
- 6.78%
- Cash-on-cash
- 1.75%
- DSCR
- 1.08
- GRM
- 7.9
CMA / ARV
- ARV (median comp)
- $329,790
- List price
- $313,750
- Delta
- -3.20%
- Verdict
- FAIR
- Comps
- 20 within 1.0 mi
Show comp detail 12 sales within ~0.75 mi
| Address | Dist | Beds/Ba | Sqft | Sold | Price | $/sf | Match |
|---|---|---|---|---|---|---|---|
| 9202 Sorrell Hollow Ln | 0.35mi | 4/2.0 | 2,216 (+8%) | 8mo | $330,000 | $149 | 64 |
| 9210 Hemlock Dr | 0.59mi | 4/2.0 | 2,140 (+4%) | 2mo | $369,999 | $173 | 64 |
| 1203 Fill House Ct | 0.41mi | 4/2.0 | 1,840 (-10%) | 4mo | $364,000 | $198 | 60 |
| 107 Angel Hollow Ln | 0.68mi | 3/2.0 (-1) | 2,050 (-0%) | 3mo | $345,000 | $168 | 60 |
| 831 Shenandoah Falls Ln | 0.64mi | 3/2.0 (-1) | 2,113 (+3%) | 3mo | $320,000 | $151 | 58 |
| 303 Arbor Green Ln | 0.41mi | 3/2.5 (-1) | 2,172 (+6%) | 8mo | $375,000 | $173 | 57 |
| 523 Bonbrook Ln | 0.70mi | 4/2.0 | 2,131 (+4%) | 8mo | $329,990 | $155 | 55 |
| 8710 Snyder Farm Ln | 0.74mi | 4/2.0 | 2,131 (+4%) | 6mo | $349,000 | $164 | 54 |
| 8707 Rocky Knoll Ln | 0.60mi | 3/2.0 (-1) | 2,280 (+11%) | 2mo | $335,000 | $147 | 47 |
| 410 N Iris Rose Ct | 0.60mi | 3/2.0 (-1) | 1,804 (-12%) | 3mo | $325,000 | $180 | 44 |
| 9207 Gilbert Hollow Dr | 0.66mi | 3/2.0 (-1) | 1,826 (-11%) | 2mo | $330,000 | $181 | 44 |
| 9007 Hemlock Dr | 0.69mi | 3/2.0 (-1) | 1,844 (-10%) | 6mo | $315,000 | $171 | 41 |
Match score weights: distance 35% · size 25% · config 20% · recency 20%. Top-matched comps best support the ARV.
Projected returns pro-forma
-3.0% appreciation · 0.0% rent growth · sell at horizon
- IRR
- -17.4%
- Equity multiple
- 0.41×
- Total profit
- $-52,147
- Equity at exit
- $46,781
- IRR
- -17.6%
- Equity multiple
- 0.19×
- Total profit
- $-71,422
- Equity at exit
- $27,127
Cash invested: $87,850 (down + closing). Projections, not guarantees.
Landlord ↔ Tenant lean methodology
- Overall (STATE)
- 87 Strongly Landlord-Friendly
- State Texas
- 87 Strongly Landlord-Friendly · R+5
- County
- — inherits STATE
- City
- — inherits STATE
ZIP-level market 77469
- Home prices YoY
- -25.1%
- Rents YoY
- -1.8%
- Active inventory
- 1332
- Price-to-rent
- 7.9×
Monthly cashflow live
- Estimated rent
- $3,313 medium interval (Pro) →
- Mortgage (P&I)
- −$1,645
- Tax from tax record
- −$644 /mo · $7,726/yr
- Insurance
- −$131
- HOA
- −$69
- Vacancy / Maint / Mgmt
- −$696
- Net cashflow
- $128
Break-even live
UW: 25.0% down · 7.5% · 30yr · 1.5% tax · 5.0% vac · 8.0% maint · 8.0% mgmt
Financing live
Cash to close
- Down payment
- $78,438
- Closing costs
- $9,412
- Reserves months
- —
- Total cash needed
- —
Loan-product check · same deal, 3 products live
Conventional
25% down · 7.5% · 30yr
- Down + closing
- —
- Monthly P&I
- —
- Monthly cashflow
- —
- DSCR
- —
- Eligible?
- —
Personal DTI + credit; lowest rate.
DSCR
20% down · 8.5% · 30yr
- Down + closing
- —
- Monthly P&I
- —
- Monthly cashflow
- —
- DSCR
- —
- Eligible?
- —
No personal income docs; deal must DSCR.
Hard money
10% down · 12.0% · 12mo
- Down + closing
- —
- Monthly P&I
- —
- Monthly cashflow
- —
- DSCR
- —
- Eligible?
- —
Short-term bridge; refi at stabilization.
Rent comps 2 comps
| Address | Beds | Baths | Sqft | Rent | $/sqft | DOM | Units | Dist |
|---|---|---|---|---|---|---|---|---|
| 615 Arbor Green Ln Rosenberg, TX | 4.0 | 3.0 | 2564 | $3,800 | $1.48 | 43d | 1 | 0.45mi |
| 2302 Grande Laurel Ct Richmond, TX | 4.0 | 3.5 | 2832 | $2,975 | $1.05 | 18d | 1 | 1.35mi |
HOA detail
- Monthly dues
- $69 · $828/yr
Listing history 15 events
-
2026-06-18days on market $313,750 Active 6 DOM
-
2026-06-17days on market $313,750 Active 5 DOM
-
2026-06-16days on market $313,750 Active 4 DOM
-
2026-06-15days on market $313,750 Active 3 DOM
-
2026-06-13remarks 699-char remark
-
2026-06-13pricedays on market $313,750 Active 1 DOM
-
2026-06-10days on market $319,250 Active 54 DOM
-
2026-06-08days on market $319,250 Active 53 DOM
-
2026-06-07days on market $319,250 Active 52 DOM
-
2026-06-04days on market $319,250 Active 49 DOM
-
2026-06-03days on market $319,250 Active 48 DOM
-
2026-06-02days on market $319,250 Active 47 DOM
-
2026-06-01days on market $319,250 Active 46 DOM
-
2026-05-31days on market $319,250 Active 45 DOM
-
2026-04-16$319,250 Active 989-char remark
ⓘ Source: listings_history table (triggers on properties + properties_extension) + one-shot
backfill from property_details.listing_events for pre-trigger history.
Tax reassessment forecast TX · Resets to sale price
- Current annual tax
- $7,726 · $644/mo
- Projected year-2 tax
- $7,726 · $644/mo
- Expected delta
- $0/yr ($0/mo · -0.0%)
ⓘ Screening estimate from a state-policy table — verify with the county assessor before closing.
Climate risk First Street
- Flood 1/10 Low FEMA zone X (unshaded) · 0% chance over 30 yrs
- Wildfire 1/10 Low
- Heat 9/10 Extreme 7 d/yr ≥111°F today · 24 d/yr by 30 yrs out
- Wind 9/10 Extreme 99% chance of damaging wind over 30 yrs
- Air quality 2/10 Low 1 unhealthy d/yr today · 1 by 30 yrs out
Nearby sold comps map
Loading sold comps map…
Walkable amenities ~0.75 mi
Loading nearby amenities…
Taxation est. · year 1
- Rental income
- $39,751
- − Mortgage interest
- −$17,575
- − Property taxes
- −$7,726
- − Insurance
- −$1,569
- − Repairs & maintenance
- −$3,180
- − Management
- −$3,180
- − HOA
- −$828
- − Depreciation
- −$9,127
- Taxable loss
- −$3,434
- Est. tax savings @ 24.0%
- +$824
- After-tax cash flow
- $2,361/yr
For passive investors: Depreciation is non-cash, so a rental often shows a tax loss while cash-flowing — sheltering income. Rental losses are passive: they offset passive income freely, and up to $25,000/yr can offset ordinary (W-2) income if you actively participate and your MAGI is under $100k (phasing out to $0 by $150k); unused losses carry forward. On sale, claimed depreciation is recaptured at up to 25%, and gains may owe capital-gains tax (a 1031 exchange can defer both). Figures are a year-1 estimate at your 24.0% rate — not tax advice; consult a CPA.
Schools (NCES district)
- District
- Lamar CISD
- NCES district ID
- 4826580
- Math proficiency
- 50% ▼ -12.00%
- Reading proficiency
- 53% ▼ -4.00%
- Median HH income
- $75,213
- Composite
- 46.43/100
- National rank
- #2452
- State rank
- #116 of 826 in TX
Livability — Rosenberg
- Score
- 62/100
- State rank
- #922
- US rank
- #16414
Category grades
Schools grade is shown separately in the Schools card above.
Census & demographics
- County
- Fort Bend County · 836,777 people
- City population
- 115,151
- Metro
- Houston-The Woodlands-Sugar Land, TX
- Population (ZIP)
- 69,826
- Household income
- $102,125
- Rent vs Own
- Severe rent burden
- 1292.0
Population outlook (Fort Bend County) Hauer SSP2
- Today (2025)
- 1,004,526 people
- By 2030
- 1,153,104 · +14.8%
- By 2040
- 1,453,718 · +44.7%
- By 2050
- 1,753,781 · +74.6%
- By 2075
- 2,455,772 · +144.5%
- By 2100
- 2,930,528 · +191.7%
Race, ethnicity, and origin ACS 2023
- Neighborhood character
- Highly diverse neighborhood (Simpson 0.76)
- Race & ethnicity
- Hispanic / Latino 29% White 27% Black 25% Two or more races 15% Asian 15%
- Hispanic origin (detail)
- Mexican 21%
- Common ancestry
- Romanian 1% Lithuanian 1%
- Foreign-born
- 24% · Canada, Vietnam, China
- Languages at home
- 65% English-only · Spanish 17% Other Indo-European 7% Other Asian/Pacific 2%
Political lean MEDSL · Fort Bend
- 2024 margin
- Toss-up / Even · D 49.5% · R 47.9% · Other 2.6%
- 2008→2024 swing
- +4.0pp toward D · 2008: -2.4pp · 2024: 1.6pp
- All cycles
- 2024: D+1.6 2020: D+10.6 2016: D+6.6 2012: R+6.8 2008: R+2.4
Not yet ingested
- Civics
- —
Market trends
- HPI YoY
- ▼ -78.66%
- Current HPI
- 234.9892
- Rent YoY
- ▼ -1.81%
- Metro
- Houston-The Woodlands-Sugar Land, TX
- State GDP YoY
- ▲ 3.95%
- F500 in state
- 110
Industry mix (Fortune 500 HQ in TX)
| Industry | F500 HQs | Revenue |
|---|---|---|
| Energy | 16 | $1,198B |
|
||
| Technology | 5 | $198B |
|
||
| Engineering / Construction | 4 | $72B |
|
||
| Energy Services | 3 | $60B |
|
||
| Utilities | 3 | $41B |
|
||
| Healthcare | 2 | $330B |
|
||
Price history
-1.7% since first listed3 events — show timeline
- 2026-06-12 Listed $313,750 HARMLS
- 2026-06-12 Listing Removed — HARMLS
- 2026-04-16 Listed $319,250 HARMLS
Property tax history
+48.8%/yrLatest (2025): $7,726 · +5.1% YoY. Source: county tax records.
Cash-flow waterfall
monthlySold comps — $/sqft
last 12 mo · ≤1 miLoading sold comps…