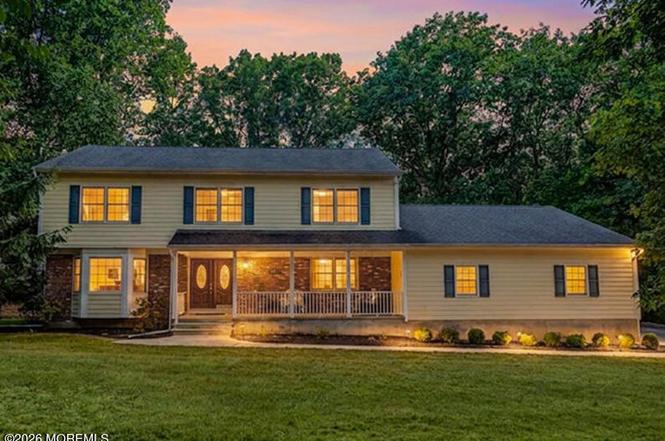
6 Rimwood Dr
Lincroft, NJ 07738
$1,275,000C+
5 bd · 3.0 ba ·
2,804 sqft ·
Built 1967
· SingleFamily
· Active
· 1 DOM
Cashflow @ list (25.0% down · 7.5%)
Estimated rent
$16,651/mo
Mortgage (P&I)
−$6,686
Tax + insurance
−$1,641
HOA
−$0
Vac / Maint / Mgmt
−$3,497
Net cashflow
$4,827/mo
Annual
$57,921/yr
Cap rate
10.84%
Cash-on-cash
16.22%
DSCR
1.72
1% rule
1.31%
Cash to close
$357,000
Investor read
- This is a 5-bed/3.0-bath single-family listed at $1.27M.
- At list price, monthly cash flow is $5k ($58k/yr) — positive.
- The deal already cash-flows at list — no discount required.
- Meets the 1% rule at list price ($17k rent vs $1.27M).
- Only 1 days on market — expect competitive offers; lowballing is unlikely to land.
- Local home prices are declining (-3.0%/yr); year-one equity from $9k of loan paydown is wiped out by about $38k of value loss. Plan a longer hold.
- Location reads 73/100 on livability (#193 in NJ) — a middle-class / working-renter tenant base. Strengths: schools A+, crime A+, employment A+; Watch: amenities F, commute F, cost of living F.
- Middletown Township Public School District (suburban): math 39% / reading 55% proficiency, ranked #135 of 472 in NJ (top 29%) — families likely to look elsewhere, expect single-tenant / working-renter base with shorter leases; only 9% free/reduced lunch — higher-income household profile.
- Market conditions: 30 active listings in the ZIP; 2 comparable units currently listed for rent nearby; 2,840 units permitted in Monmouth County in 2024 (484 in 5+ unit buildings).
- Monmouth County population projected at -11% by 2050 — secular population decline; favor cash flow + early exit over multi-decade hold.
- Current owner paid $265k; list at $1.27M implies a 381% gain — meaningful room to come down on a strong offer.
- At projected returns (-3.0% appreciation + 3.0% rent growth), your $357k cash investment doubles in ~8 years — after that, you're playing with house money.
- Climate carrying-cost: severe wind risk, 80% chance of damaging wind over 30y; extreme-heat days projected 7→14/yr by 2055 (HVAC capex compounding) — expect insurance premiums to compound above CPI over the hold.
- Cap rate 10.8% vs local median 1.4% in Lincroft — top-decile yield for the area; either an underpriced asset or a hidden risk that comps aren't pricing in. Stress-test before assuming the spread holds.
Questions for listing agent
- Built in 1967 — when were the roof, HVAC, electrical panel, plumbing, and water heater last replaced?
- Is there a deadline driving the sale (1031 exchange, divorce, estate, relocation)? That informs how much negotiation room exists.
- Schools are A-rated — typically a magnet for longer-tenancy family renters. What's the average tenant stay here, and is there a school-zone premium baked into asking?
- This sits on a lake — are riparian / water-frontage rights deeded with the parcel? Any dock permits, shoreline easements, or HOA water-use restrictions?
- What's the documented flood / surge / shoreline-erosion history here (FEMA AND non-FEMA — e.g., storm surge, creek backup, septic-field saturation)?
- Any water-quality or seasonal algae-bloom issues that affect tenant satisfaction or short-term-rental demand?
- What's the average days-on-market for RENTAL listings here right now (not sales)? A rising rental-DOM trend means longer vacancies and softer asking-rent achievability than the comps imply.
- What's the recent tenant-quality profile in this submarket — average credit score on applications, eviction rate, late-payment / NSF rate, and stable-employment percentage? A property-management company in the area should have these aggregated.
CashFlowRE · CFR-4F9MED0AE8BN7B
· Data 2 days ago
cashflowre.app · 2026-05-29