 🌊 Lakefront
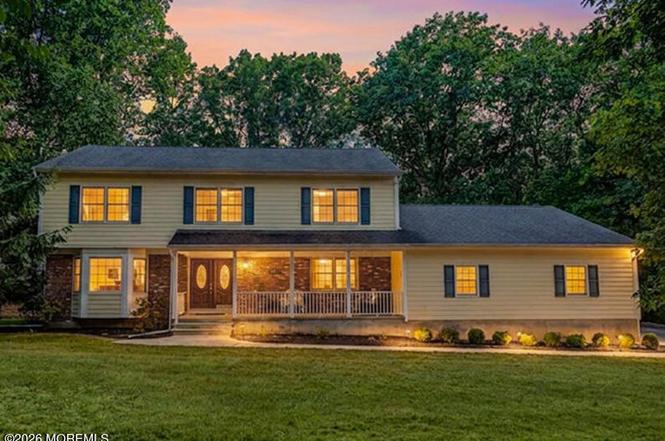
6 Rimwood Dr · Lincroft, NJ
Flood risk 1/10 · Minimal
- FEMA flood zone
- X (unshaded)
- Chance of flooding over 30 yrs
- 0.0%
- Est. flood insurance / yr
- $473 – $860
Fire risk 3/10 · Minor
- Est. fire insurance / yr
- $526 – $976
Heat risk 7/10 · Major
- Hot days now (above 96°F)
- 7 days/yr
- Hot days in 30 yrs
- 14 days/yr
Wind risk 8/10 · Major
- Chance of severe wind over 30 yrs
- 80.0%
Air-quality risk 3/10 · Minor
- Unhealthy air days now
- 3 days/yr
- Unhealthy air days in 30 yrs
- 4 days/yr
Risk factors via First Street. Map © Google.
Why this score? — see what drove the C+ grade
The composite is a weighted blend of 9 inputs, each scored 0–100. Each bar is that input's sub-score; the figure is the points it added to the 100-point composite (weight × sub-score).
- Cash flow +30.0/30.0
- DSCR +10.0/10.0
- 1% rule +8.1/10.0
- Schools +4.5/10.0
- Livability +3.7/5.0
- Rent growth +2.5/5.0
- Condition / age +2.5/5.0
- ARV discount +1.6/15.0
- Appreciation +0.0/10.0
$1,275,000
🖨 Deal sheet 📄 Offer letter ✓ Due diligence
Listing remarks
Rarely does an opportunity like this become available in ONE of NJ most sought-after neighborhoods. Perched on a breathtaking hilltop Waterfront overlooking the Reservoir, this exceptional 5-bedroom residence offers a rare combination of privacy, nature, & elegance. Set on an extra-large property with picturesque water views, the home features a spacious kitchen, oversized living & family rooms, spacious basement with endless possibilities, and a large garage with abundant storage. Expansive windows fill the home with light and showcase the stunning surroundings. Located within the highly regarded Middletown South school district, this private retreat is truly a special place to
Key facts
- 1.23 acre lot
- 2 garage spots
- Built 1967
Property features AI
Exterior
- Parking: Attached 2-car garage
- Utilities: Public sewer
- Home design: Fee simple ownership
- Construction: Shingle roof; Basement: full, partially finished, heated, walk-out access
- Exterior features: Waterfront property with bayfront, bayside, bayview, lagoon, pond, riverview and riparian rights; Other waterfront features (see remarks)
Interior
- Kitchen: Dishwasher; Refrigerator
- Bedrooms: 5 bedrooms
- Flooring: Wood flooring
- Bathrooms: 3 full bathrooms
- Heating & cooling: Forced air heating; Central air conditioning
- Interior features: Includes washer, dryer, dishwasher, refrigerator, and garage door opener; Ceilings are high in basement areas; Basement has workshop/workbench and walk-out access; Basement is partially finished and heated
- Laundry & utility: Washer; Dryer
Neighborhood map
What this means for you Summary
Snapshot
- This is a 5-bed/3.0-bath single-family listed at $1.27M.
Deal economics
- At list price, monthly cash flow is $5k ($58k/yr) — positive.
- The deal already cash-flows at list — no discount required.
- Meets the 1% rule at list price ($17k rent vs $1.27M).
- Cap rate 10.8% vs local median 1.4% in Lincroft — top-decile yield for the area; either an underpriced asset or a hidden risk that comps aren't pricing in. Stress-test before assuming the spread holds.
Location & tenants
- Location reads 73/100 on livability (#193 in NJ) — a middle-class / working-renter tenant base. Strengths: schools A+, crime A+, employment A+; Watch: amenities F, commute F, cost of living F.
- Middletown Township Public School District (suburban): math 39% / reading 55% proficiency, ranked #135 of 472 in NJ (top 29%) — families likely to look elsewhere, expect single-tenant / working-renter base with shorter leases; only 9% free/reduced lunch — higher-income household profile.
- Market conditions: 30 active listings in the ZIP; 2 comparable units currently listed for rent nearby; 2,840 units permitted in Monmouth County in 2024 (484 in 5+ unit buildings).
Forward outlook
- Local home prices are declining (-3.0%/yr); year-one equity from $9k of loan paydown is wiped out by about $38k of value loss. Plan a longer hold.
- Monmouth County population projected at -11% by 2050 — secular population decline; favor cash flow + early exit over multi-decade hold.
- At projected returns (-3.0% appreciation + 3.0% rent growth), your $357k cash investment doubles in ~8 years — after that, you're playing with house money.
Negotiation context
- Only 1 days on market — expect competitive offers; lowballing is unlikely to land.
- Current owner paid $265k; list at $1.27M implies a 381% gain — meaningful room to come down on a strong offer.
Risks & watch-outs
- Climate carrying-cost: severe wind risk, 80% chance of damaging wind over 30y; extreme-heat days projected 7→14/yr by 2055 (HVAC capex compounding) — expect insurance premiums to compound above CPI over the hold.
Questions for the listing agent
- Built in 1967 — when were the roof, HVAC, electrical panel, plumbing, and water heater last replaced?
- Is there a deadline driving the sale (1031 exchange, divorce, estate, relocation)? That informs how much negotiation room exists.
- Schools are A-rated — typically a magnet for longer-tenancy family renters. What's the average tenant stay here, and is there a school-zone premium baked into asking?
- This sits on a lake — are riparian / water-frontage rights deeded with the parcel? Any dock permits, shoreline easements, or HOA water-use restrictions?
- What's the documented flood / surge / shoreline-erosion history here (FEMA AND non-FEMA — e.g., storm surge, creek backup, septic-field saturation)?
- Any water-quality or seasonal algae-bloom issues that affect tenant satisfaction or short-term-rental demand?
- What's the average days-on-market for RENTAL listings here right now (not sales)? A rising rental-DOM trend means longer vacancies and softer asking-rent achievability than the comps imply.
- What's the recent tenant-quality profile in this submarket — average credit score on applications, eviction rate, late-payment / NSF rate, and stable-employment percentage? A property-management company in the area should have these aggregated.
- How much new for-sale + rental construction is in the pipeline within 1–3 miles? Heavy new supply typically softens prices + rents 12–24 months out; constrained supply supports both.
Investment metrics
- 1% rule
- 1.31% ✓
- Cap rate
- 10.84%
- Cash-on-cash
- 16.22%
- DSCR
- 1.72
- GRM
- 6.4
CMA / ARV
- ARV (on-the-fly)
- $1,127,208
- Comps found
- 9
Show comp detail 9 sales within ~0.75 mi
| Address | Dist | Beds/Ba | Sqft | Sold | Price | $/sf | Match |
|---|---|---|---|---|---|---|---|
| 16 Hickory Ln | 0.33mi | 4/2.5 (-1) | 2,649 (-6%) | 7mo | $1,198,000 | $452 | 63 |
| 119 Lindy Ln | 0.43mi | 4/3.0 (-1) | 3,156 (+13%) | 6mo | $1,395,000 | $442 | 49 |
| 55 Swimming River Rd | 0.51mi | 6/3.5 (+1) | 2,698 (-4%) | 19mo | $850,000 | $315 | 47 |
| 44 Majestic Ave | 0.58mi | 4/3.5 (-1) | 3,000 (+7%) | 11mo | $1,375,000 | $458 | 45 |
| 61 Woodhollow Rd | 0.74mi | 4/2.5 (-1) | 2,560 (-9%) | 1mo | $1,320,000 | $516 | 43 |
| 38 Pine St | 0.45mi | 4/3.5 (-1) | 2,422 (-14%) | 10mo | $920,000 | $380 | 41 |
| 4 E Point Rd | 0.39mi | 4/3.0 (-1) | 2,484 (-11%) | 24mo | $999,000 | $402 | 38 |
| 53 Pine St | 0.34mi | 4/2.5 (-1) | 2,438 (-13%) | 21mo | $975,000 | $400 | 38 |
| 9 Pine St | 0.59mi | 4/2.5 (-1) | 2,430 (-13%) | 19mo | $810,000 | $333 | 28 |
Match score weights: distance 35% · size 25% · config 20% · recency 20%. Top-matched comps best support the ARV.
Projected returns pro-forma
-3.0% appreciation · 3.0% rent growth · sell at horizon
- IRR
- 7.2%
- Equity multiple
- 1.28×
- Total profit
- $100,765
- Equity at exit
- $190,107
- IRR
- 16.5%
- Equity multiple
- 2.35×
- Total profit
- $483,404
- Equity at exit
- $110,239
Cash invested: $357,000 (down + closing). Projections, not guarantees.
Landlord ↔ Tenant lean methodology
- Overall (STATE)
- 21 Tenant-Leaning
- State New Jersey
- 21 Tenant-Leaning · D+6
- County
- — inherits STATE
- City
- — inherits STATE
ZIP-level market 07738
- Home prices YoY
- -24.5%
- Active inventory
- 30
- Price-to-rent
- 6.4×
Monthly cashflow live
- Estimated rent
- $16,651 medium interval (Pro) →
- Mortgage (P&I)
- −$6,686
- Tax from tax record
- −$1,110 /mo · $13,320/yr
- Insurance
- −$531
- HOA
- −$0
- Vacancy / Maint / Mgmt
- −$3,497
- Net cashflow
- $4,827
Break-even live
UW: 25.0% down · 7.5% · 30yr · 1.5% tax · 5.0% vac · 8.0% maint · 8.0% mgmt
Financing live
Cash to close
- Down payment
- $318,750
- Closing costs
- $38,250
- Reserves months
- —
- Total cash needed
- —
Loan-product check · same deal, 3 products live
Conventional
25% down · 7.5% · 30yr
- Down + closing
- —
- Monthly P&I
- —
- Monthly cashflow
- —
- DSCR
- —
- Eligible?
- —
Personal DTI + credit; lowest rate.
DSCR
20% down · 8.5% · 30yr
- Down + closing
- —
- Monthly P&I
- —
- Monthly cashflow
- —
- DSCR
- —
- Eligible?
- —
No personal income docs; deal must DSCR.
Hard money
10% down · 12.0% · 12mo
- Down + closing
- —
- Monthly P&I
- —
- Monthly cashflow
- —
- DSCR
- —
- Eligible?
- —
Short-term bridge; refi at stabilization.
Rent comps 2 comps
| Address | Beds | Baths | Sqft | Rent | $/sqft | DOM | Units | Dist |
|---|---|---|---|---|---|---|---|---|
| 65 Phalanx Rd Lincroft, NJ | 4.0 | 3.0 | 3062 | $20,000 | $6.53 | 1d | 1 | 0.25mi |
| 3 Rose St Lincroft, NJ | 4.0 | 4.5 | 2944 | $5,800 | $1.97 | 2d | 1 | 0.85mi |
Listing history 2 events
-
2026-06-18remarks 691-char remark
-
2026-06-18$1,275,000 Active 1 DOM
ⓘ Source: listings_history table (triggers on properties + properties_extension) + one-shot
backfill from property_details.listing_events for pre-trigger history.
Tax reassessment forecast NJ · Partial reset (capped growth)
- Current annual tax
- $13,320 · $1,110/mo
- Projected year-2 tax
- $22,534 · $1,878/mo
- Expected delta
- +$9,214/yr (+$768/mo · 69.2%)
ⓘ Screening estimate from a state-policy table — verify with the county assessor before closing.
Climate risk First Street
- Flood 1/10 Low FEMA zone X (unshaded) · 0% chance over 30 yrs
- Wildfire 3/10 Moderate
- Heat 7/10 Severe 7 d/yr ≥96°F today · 14 d/yr by 30 yrs out
- Wind 8/10 Severe 80% chance of damaging wind over 30 yrs
- Air quality 3/10 Moderate 3 unhealthy d/yr today · 4 by 30 yrs out
Nearby sold comps map
Loading sold comps map…
Walkable amenities ~0.75 mi
Loading nearby amenities…
Taxation est. · year 1
- Rental income
- $199,811
- − Mortgage interest
- −$71,420
- − Property taxes
- −$13,320
- − Insurance
- −$6,375
- − Repairs & maintenance
- −$15,985
- − Management
- −$15,985
- − Depreciation
- −$37,091
- Taxable income
- $39,635
- Est. tax owed @ 24.0%
- −$9,512
- After-tax cash flow
- $48,408/yr
For passive investors: Depreciation is non-cash, so a rental often shows a tax loss while cash-flowing — sheltering income. Rental losses are passive: they offset passive income freely, and up to $25,000/yr can offset ordinary (W-2) income if you actively participate and your MAGI is under $100k (phasing out to $0 by $150k); unused losses carry forward. On sale, claimed depreciation is recaptured at up to 25%, and gains may owe capital-gains tax (a 1031 exchange can defer both). Figures are a year-1 estimate at your 24.0% rate — not tax advice; consult a CPA.
Schools (NCES district)
- District
- Middletown Township Public School District
- NCES district ID
- 3410110
- Math proficiency
- 39% ▼ -13.00%
- Reading proficiency
- 55% ▼ -10.00%
- Median HH income
- $100,708
- Composite
- 45.08/100
- National rank
- #2694
- State rank
- #135 of 472 in NJ
Livability — Lincroft
- Score
- 73/100
- State rank
- #193
- US rank
- #5456
Category grades
Schools grade is shown separately in the Schools card above.
Census & demographics
- Census place
- Lincroft, NJ
- City population
- 6,901
- Population (ZIP)
- 6,901
Population outlook (Monmouth County) Hauer SSP2
- Today (2025)
- 620,308 people
- By 2030
- 612,309 · -1.3%
- By 2040
- 587,297 · -5.3%
- By 2050
- 551,342 · -11.1%
- By 2075
- 472,934 · -23.8%
- By 2100
- 381,534 · -38.5%
Race, ethnicity, and origin ACS 2023
- Neighborhood character
- Predominantly White (85%)
- Race & ethnicity
- White 85% Hispanic / Latino 7% Two or more races 5% Asian 4% Black 1%
- Hispanic origin (detail)
- Puerto Rican 5% Cuban 1%
- Common ancestry
- Romanian 7% Subsaharan African 5% Italian 2%
- Foreign-born
- 8% · China, Canada
- Languages at home
- 86% English-only · Other Indo-European 5% Spanish 3% Russian/Polish/Slavic 3%
Political lean MEDSL · Monmouth
- 2024 margin
- R (+11.4) · D 43.4% · R 54.8% · Other 1.8%
- 2008→2024 swing
- -7.7pp toward R · 2008: -3.7pp · 2024: -11.4pp
- All cycles
- 2024: R+11.4 2020: R+2.8 2016: R+9.5 2012: R+5.5 2008: R+3.7
Not yet ingested
- Civics
- —
Market trends
- HPI YoY
- ▼ -113.36%
- Current HPI
- 349.998
- Rent YoY
- —
- Metro
- —
- State GDP YoY
- ▲ 2.05%
- F500 in state
- 34
Industry mix (Fortune 500 HQ in NJ)
| Industry | F500 HQs | Revenue |
|---|---|---|
| Consumer Goods | 3 | $31B |
|
||
| Pharmaceuticals | 2 | $153B |
|
||
| Technology | 2 | $21B |
|
||
| Insurance | 2 | $20B |
|
||
| Healthcare | 2 | $19B |
|
||
| Financial Services | 1 | $70B |
|
||
Price history
+1306.5% since first listed3 events — show timeline
- 2026-06-18 Listed $1,275,000 MOMLS
- 1985-06-30 Sold (Public Records) $265,000 Public Records
- 1984-05-01 Sold (Public Records) $90,650 Public Records
Property tax history
+1.0%/yrLatest (2025): $13,320 · -1.0% YoY. Source: county tax records.
Cash-flow waterfall
monthlySold comps — $/sqft
last 12 mo · ≤1 miLoading sold comps…