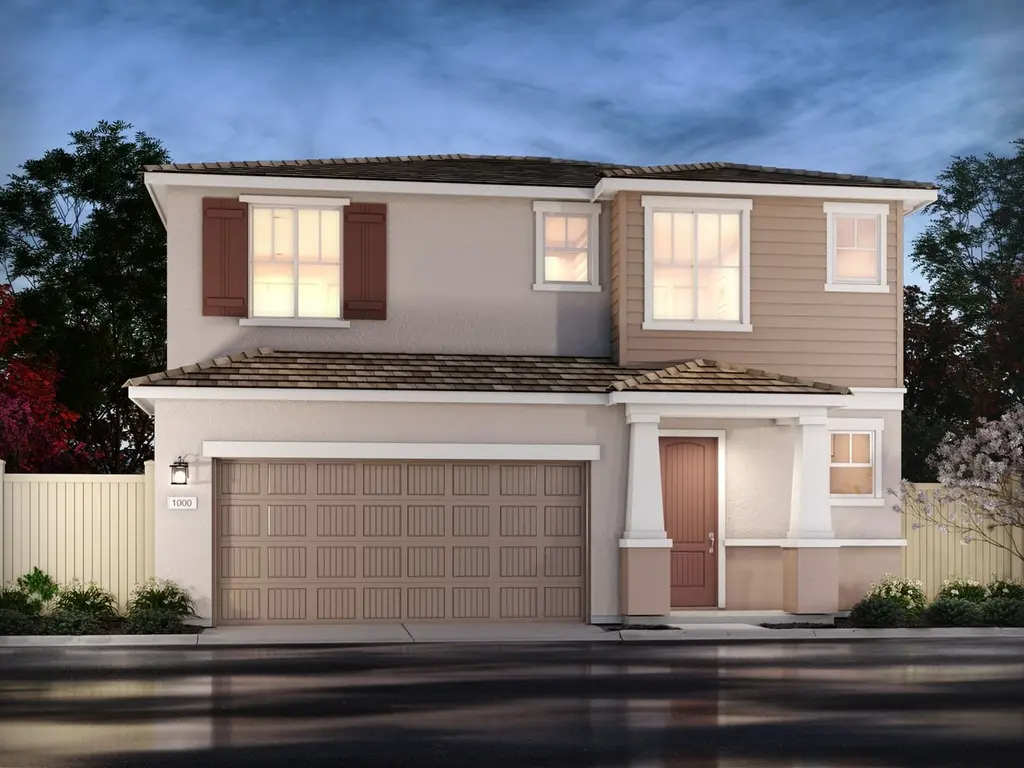
1153 Tropic Ct
Redlands, CA 92374
$617,500D-
3 bd · 2.5 ba ·
1,684 sqft ·
Built 2026
· SingleFamily
· Active
· 8 DOM
Cashflow @ list (25.0% down · 7.5%)
Estimated rent
$4,977/mo
Mortgage (P&I)
−$3,238
Tax + insurance
−$1,029
HOA
−$0
Vac / Maint / Mgmt
−$1,045
Net cashflow
$-336/mo
Annual
$-4,031/yr
Cap rate
5.64%
Cash-on-cash
-2.33%
DSCR
0.90
1% rule
0.81%
Cash to close
$172,900
Investor read
- This is a 3-bed/2.5-bath single-family listed at $618k. Condition is rated fair.
- At list price, monthly cash flow is $-336 ($-4k/yr) — negative.
- To cash-flow at today's rent, offer at most $569k (7.9% below list).
- To meet the 1% rule (rent ≥ 1% of price), the offer needs to be $498k (19.4% below list).
- Only 8 days on market — expect competitive offers; lowballing is unlikely to land.
- Recommended offer: $498k (19.4% below list) — sets the bar for 1% rule.
- Local home prices are declining (-3.0%/yr); year-one equity from $4k of loan paydown is wiped out by about $19k of value loss. Plan a longer hold.
- Location reads 75/100 on livability (#118 in CA, #4,193 nationally) — a middle-class / working-renter tenant base. Strengths: amenities A+, commute A+, employment A+; Watch: crime C-, health & safety D, cost of living F.
- Redlands Unified (urban): math 44% / reading 57% proficiency, ranked #390 of 1,400 in CA (top 28%) — acceptable for families but not a draw, mixed tenant base, ~2y average lease.
- Market conditions: Rents rising (+3.7%/yr); 103 active listings in the ZIP; 9 comparable units currently listed for rent nearby; rentals at typical pace (median 25d on market — plan ~3-4 weeks tenant-placement turnaround); 44% of comp listings sitting > 30 days — soft ceiling on asking rent; solid renter incomes; 5,458 units permitted in San Bernardino County in 2024 (1,500 in 5+ unit buildings).
- San Bernardino County population projected at +15% by 2050 — modest demand growth; plan on rents tracking national, not racing it.
- Cap rate 5.6% vs local median 2.8% in Redlands — top-decile yield for the area; either an underpriced asset or a hidden risk that comps aren't pricing in. Stress-test before assuming the spread holds.
- At $4,977/mo this rent would consume 58% of the median local household income ($103k/yr) (locally 1176% of renters already pay >50% of income on rent) — very limited rent-growth headroom before tenants either downsize or default.
Questions for listing agent
- What do current leases actually rent for vs. the listed asking? Can we see a recent rent roll and the last 12 months of T-12 income?
- Have any recent inspections been done? Can we get a copy of the seller's disclosures and any deferred-maintenance estimates?
- Is there a deadline driving the sale (1031 exchange, divorce, estate, relocation)? That informs how much negotiation room exists.
- Schools are B-rated — typically a magnet for longer-tenancy family renters. What's the average tenant stay here, and is there a school-zone premium baked into asking?
- The area grade is low — what's the realistic commute time and amenity access for the typical tenant pool here? Any planned neighborhood developments (good or bad) we should know about?
- What's the average days-on-market for RENTAL listings here right now (not sales)? A rising rental-DOM trend means longer vacancies and softer asking-rent achievability than the comps imply.
- What's the recent tenant-quality profile in this submarket — average credit score on applications, eviction rate, late-payment / NSF rate, and stable-employment percentage? A property-management company in the area should have these aggregated.
- How much new for-sale + rental construction is in the pipeline within 1–3 miles? Heavy new supply typically softens prices + rents 12–24 months out; constrained supply supports both.
Repairs flagged (vision-AI assessment)
- Major: roof — The independent satellite image shows a large, unfinished construction site with no visible roof.
- Major: exterior/siding — The independent satellite image shows a large, unfinished construction site with no visible siding.
- Major: windows — The independent satellite image shows a large, unfinished construction site with no visible windows.
- Major: foundation/structure — The independent satellite image shows a large, unfinished construction site with no visible foundation or structure.
- Major: HVAC/mechanicals — The independent satellite image shows a large, unfinished construction site with no visible HVAC or mechanical systems.
- Major: landscaping/curb appeal — The independent satellite image shows a large, unfinished construction site with no visible landscaping or curb appeal.
CashFlowRE · CFR-4FQJ4P0DSKVZ54
· Data 2 days ago
cashflowre.app · 2026-05-29