1153 Tropic Ct · Redlands, CA
Flood risk No data
- FEMA flood zone
- —
- Chance of flooding over 30 yrs
- —
- Est. flood insurance / yr
- —
Fire risk No data
- Est. fire insurance / yr
- —
Heat risk No data
- Hot days now (above threshold)
- —
- Hot days in 30 yrs
- —
Wind risk No data
- Chance of severe wind over 30 yrs
- —
Air-quality risk No data
- Unhealthy air days now
- —
- Unhealthy air days in 30 yrs
- —
Risk factors via First Street. Map © Google.
Why this score? — see what drove the D- grade
The composite is a weighted blend of 9 inputs, each scored 0–100. Each bar is that input's sub-score; the figure is the points it added to the 100-point composite (weight × sub-score).
- Cash flow +10.3/30.0
- ARV discount +8.1/15.0
- Schools +4.7/10.0
- Livability +3.8/5.0
- Rent growth +3.4/5.0
- 1% rule +3.1/10.0
- DSCR +3.0/10.0
- Condition / age +2.2/5.0
- Appreciation +0.0/10.0
$617,500
🖨 Deal sheet 📄 Offer letter ✓ Due diligence
Listing remarks
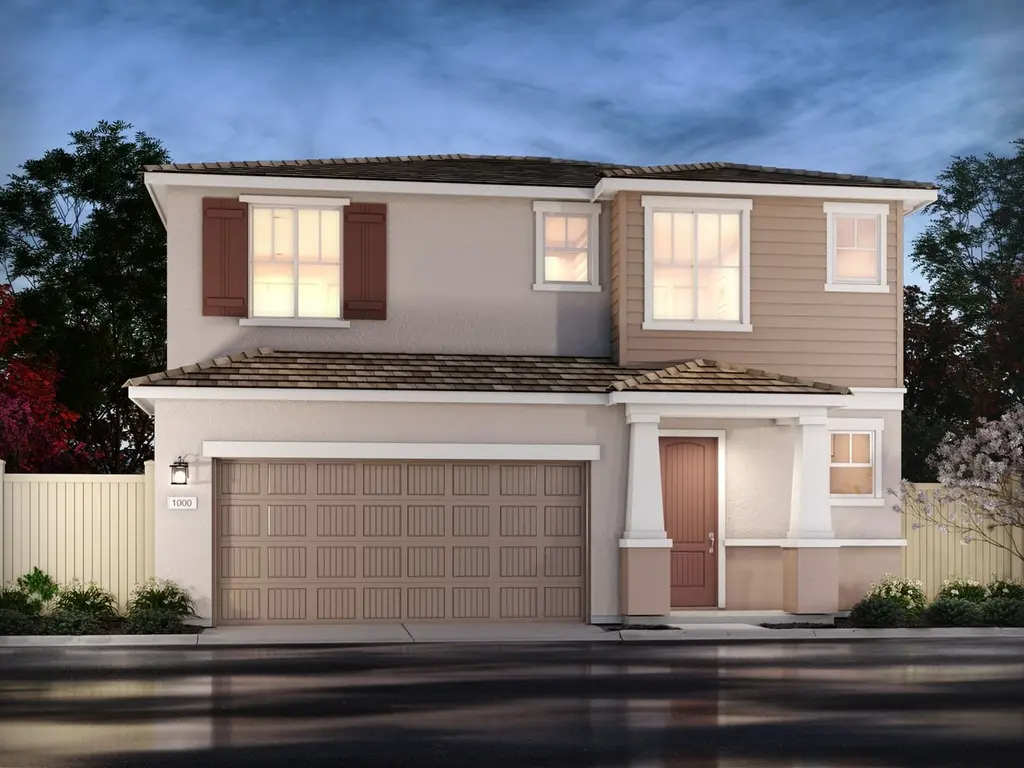
Homeowners will love the impressive walk-in closet located just off the primary suite bathroom. Sizeable secondary bedrooms are ideal for kids or home office. The spacious great room flows seamlessly into the dining and kitchen to create an open feel.
Key facts
- Walk-in closet
- Dining and kitchen
- Great room
Tags
Property features AI
Finance
- Other: Address: 1153 Tropic Ct, Redlands CA 92374; Listing last modified 2026-06-12
- Financial info: List price $617,500
Exterior
- Parking: 2 parking spaces
- Home design: Single-family residence; Model: Residence 2; Facing direction not specified
- Exterior features: Living area approximately 1684 (listing value)
Interior
- Bedrooms: 3 bedrooms
- Bathrooms: 2 full bathrooms, 1 half bathroom
- Interior features: Spec home (Residence 2 plan); Active listing
Neighborhood map
What this means for you Summary
Snapshot
- This is a 3-bed/2.5-bath single-family listed at $618k. Condition is rated fair.
Deal economics
- At list price, monthly cash flow is $-336 ($-4k/yr) — negative.
- To cash-flow at today's rent, offer at most $569k (7.9% below list).
- To meet the 1% rule (rent ≥ 1% of price), the offer needs to be $498k (19.4% below list).
- Recommended offer: $498k (19.4% below list) — sets the bar for 1% rule.
- Cap rate 5.6% vs local median 2.8% in Redlands — top-decile yield for the area; either an underpriced asset or a hidden risk that comps aren't pricing in. Stress-test before assuming the spread holds.
Location & tenants
- Location reads 75/100 on livability (#118 in CA, #4,193 nationally) — a middle-class / working-renter tenant base. Strengths: amenities A+, commute A+, employment A+; Watch: crime C-, health & safety D, cost of living F.
- Redlands Unified (urban): math 44% / reading 57% proficiency, ranked #390 of 1,400 in CA (top 28%) — acceptable for families but not a draw, mixed tenant base, ~2y average lease.
- Market conditions: Rents rising (+3.7%/yr); 103 active listings in the ZIP; 9 comparable units currently listed for rent nearby; rentals at typical pace (median 24d on market — plan ~3-4 weeks tenant-placement turnaround); 44% of comp listings sitting > 30 days — soft ceiling on asking rent; solid renter incomes; 5,458 units permitted in San Bernardino County in 2024 (1,500 in 5+ unit buildings).
- At $4,977/mo this rent would consume 58% of the median local household income ($103k/yr) (locally 1176% of renters already pay >50% of income on rent) — very limited rent-growth headroom before tenants either downsize or default.
Forward outlook
- Local home prices are declining (-3.0%/yr); year-one equity from $4k of loan paydown is wiped out by about $19k of value loss. Plan a longer hold.
- San Bernardino County population projected at +15% by 2050 — modest demand growth; plan on rents tracking national, not racing it.
Negotiation context
- Only 8 days on market — expect competitive offers; lowballing is unlikely to land.
Questions for the listing agent
- What do current leases actually rent for vs. the listed asking? Can we see a recent rent roll and the last 12 months of T-12 income?
- Have any recent inspections been done? Can we get a copy of the seller's disclosures and any deferred-maintenance estimates?
- Is there a deadline driving the sale (1031 exchange, divorce, estate, relocation)? That informs how much negotiation room exists.
- Schools are B-rated — typically a magnet for longer-tenancy family renters. What's the average tenant stay here, and is there a school-zone premium baked into asking?
- The area grade is low — what's the realistic commute time and amenity access for the typical tenant pool here? Any planned neighborhood developments (good or bad) we should know about?
- What's the average days-on-market for RENTAL listings here right now (not sales)? A rising rental-DOM trend means longer vacancies and softer asking-rent achievability than the comps imply.
- What's the recent tenant-quality profile in this submarket — average credit score on applications, eviction rate, late-payment / NSF rate, and stable-employment percentage? A property-management company in the area should have these aggregated.
- How much new for-sale + rental construction is in the pipeline within 1–3 miles? Heavy new supply typically softens prices + rents 12–24 months out; constrained supply supports both.
Investment metrics
- 1% rule
- 0.81% ✗
- Cap rate
- 5.64%
- Cash-on-cash
- -2.33%
- DSCR
- 0.90
- GRM
- 10.3
CMA / ARV
- ARV (on-the-fly)
- $626,448
- Comps found
- 12
Show comp detail 12 sales within ~0.75 mi
| Address | Dist | Beds/Ba | Sqft | Sold | Price | $/sf | Match |
|---|---|---|---|---|---|---|---|
| 1118 Tropic Ct | 0.05mi | 3/2.5 | 1,648 (-2%) | 1mo | $554,000 | $336 | 93 |
| 2147 Bergamot St | 0.06mi | 3/2.5 | 1,648 (-2%) | 1mo | $564,000 | $342 | 93 |
| 1132 Tropic Ct | 0.05mi | 3/2.5 | 1,465 (-13%) | 0mo | $549,000 | $375 | 76 |
| 1136 Tropic Ct | 0.05mi | 3/2.5 | 1,465 (-13%) | 0mo | $554,000 | $378 | 76 |
| 1116 Tropic Ct | 0.06mi | 3/2.5 | 1,465 (-13%) | 2mo | $545,000 | $372 | 74 |
| 2069 Meyer Ln | 0.24mi | 3/2.5 | 1,816 (+8%) | 4mo | $670,000 | $369 | 73 |
| 2165 Bergamot St | 0.06mi | 3/2.5 | 1,465 (-13%) | 5mo | $569,000 | $388 | 72 |
| 2063 Tangelo Ln | 0.28mi | 3/3.0 | 1,816 (+8%) | 2mo | $687,500 | $379 | 71 |
| 2185 Bergamot St | 0.07mi | 3/2.5 | 1,465 (-13%) | 6mo | $569,000 | $388 | 70 |
| 2040 Tangelo Ln | 0.31mi | 3/3.0 | 1,816 (+8%) | 2mo | $649,000 | $357 | 69 |
| 2040 Meyer Ln | 0.28mi | 3/3.0 | 1,816 (+8%) | 5mo | $649,000 | $357 | 68 |
| 1679 Camellia | 0.63mi | 4/2.5 (+1) | 1,864 (+11%) | 2mo | $665,000 | $357 | 47 |
Match score weights: distance 35% · size 25% · config 20% · recency 20%. Top-matched comps best support the ARV.
Projected returns pro-forma
-3.0% appreciation · 3.73% rent growth · sell at horizon
- IRR
- -19.3%
- Equity multiple
- 0.32×
- Total profit
- $-117,698
- Equity at exit
- $92,071
- IRR
- -10.6%
- Equity multiple
- 0.34×
- Total profit
- $-114,397
- Equity at exit
- $53,390
Cash invested: $172,900 (down + closing). Projections, not guarantees.
Landlord ↔ Tenant lean methodology
- Overall (STATE)
- 18 Strongly Tenant-Friendly
- State California
- 18 Strongly Tenant-Friendly · D+13
- County
- — inherits STATE
- City
- — inherits STATE
ZIP-level market 92374
- Rents YoY
- 3.7%
- Active inventory
- 103
- Price-to-rent
- 10.3×
Monthly cashflow live
- Estimated rent
- $4,977 high interval (Pro) →
- Mortgage (P&I)
- −$3,238
- Tax est. 1.5%
- −$772 /mo · $9,262/yr
- Insurance
- −$257
- HOA
- −$0
- Vacancy / Maint / Mgmt
- −$1,045
- Net cashflow
- $-336
Break-even live
UW: 25.0% down · 7.5% · 30yr · 1.5% tax · 5.0% vac · 8.0% maint · 8.0% mgmt
Financing live
Cash to close
- Down payment
- $154,375
- Closing costs
- $18,525
- Reserves months
- —
- Total cash needed
- —
Loan-product check · same deal, 3 products live
Conventional
25% down · 7.5% · 30yr
- Down + closing
- —
- Monthly P&I
- —
- Monthly cashflow
- —
- DSCR
- —
- Eligible?
- —
Personal DTI + credit; lowest rate.
DSCR
20% down · 8.5% · 30yr
- Down + closing
- —
- Monthly P&I
- —
- Monthly cashflow
- —
- DSCR
- —
- Eligible?
- —
No personal income docs; deal must DSCR.
Hard money
10% down · 12.0% · 12mo
- Down + closing
- —
- Monthly P&I
- —
- Monthly cashflow
- —
- DSCR
- —
- Eligible?
- —
Short-term bridge; refi at stabilization.
Rent comps 9 comps
| Address | Beds | Baths | Sqft | Rent | $/sqft | DOM | Units | Dist |
|---|---|---|---|---|---|---|---|---|
| 1121 Tropic Ct Redlands, CA | 4.0 | 3.0 | 2125 | $7,575 | $3.56 | 43d | 1 | 0.04mi |
| 27431 San Bernardino Ave Redlands, CA | 1.0–2.0 | 1.0–2.0 | 885 | $3,065 | $3.46 | 3d | 17 | 0.86mi |
| 1538 Webster St Redlands, CA | 4.0 | 2.0 | 1350 | $3,495 | $2.59 | 43d | 1 | 1.08mi |
| 1808 Cave St Redlands, CA | 3.0 | 2.5 | 1569 | $3,200 | $2.04 | 44d | 1 | 1.18mi |
| 1555 Orange St Unit 1007 Redlands, CA | 3.0 | 2.5 | 1314 | $2,850 | $2.17 | 5d | 1 | 1.20mi |
| 120 Doyle Ave Redlands, CA | 4.0 | 1.5 | 1431 | $2,850 | $1.99 | 24d | 1 | 1.22mi |
| 1312 Live Oak Ct Unit 1 Redlands, CA | 3.0 | 2.0 | 1120 | $2,895 | $2.58 | 43d | 1 | 1.29mi |
| 503 W Lugonia Ave Redlands, CA | 2.0 | 2.0 | 1357 | $2,500 | $1.84 | 20d | 1 | 1.33mi |
| 27000 W Lugonia Ave Redlands, CA | 1.0–3.0 | 1.0–2.0 | 1068 | $3,350 | $3.14 | 1d | 3 | 1.39mi |
Listing history 7 events
-
2026-06-18days on market $617,500 Active 8 DOM
-
2026-06-17days on market $617,500 Active 7 DOM
-
2026-06-16days on market $617,500 Active 6 DOM
-
2026-06-15days on market $617,500 Active 5 DOM
-
2026-06-13days on market $617,500 Active 3 DOM
-
2026-06-13remarks 251-char remark
-
2026-06-13$617,500 Active 2 DOM
ⓘ Source: listings_history table (triggers on properties + properties_extension) + one-shot
backfill from property_details.listing_events for pre-trigger history.
Nearby sold comps map
Loading sold comps map…
Walkable amenities ~0.75 mi
Loading nearby amenities…
Taxation est. · year 1
- Rental income
- $59,719
- − Mortgage interest
- −$34,590
- − Property taxes
- −$9,262
- − Insurance
- −$3,088
- − Repairs & maintenance
- −$4,778
- − Management
- −$4,778
- − Depreciation
- −$17,964
- Taxable loss
- −$14,739
- Est. tax savings @ 24.0%
- +$3,537
- After-tax cash flow
- $-493/yr
For passive investors: Depreciation is non-cash, so a rental often shows a tax loss while cash-flowing — sheltering income. Rental losses are passive: they offset passive income freely, and up to $25,000/yr can offset ordinary (W-2) income if you actively participate and your MAGI is under $100k (phasing out to $0 by $150k); unused losses carry forward. On sale, claimed depreciation is recaptured at up to 25%, and gains may owe capital-gains tax (a 1031 exchange can defer both). Figures are a year-1 estimate at your 24.0% rate — not tax advice; consult a CPA.
Condition & rehab AI · 10 photos
This property is in a large, unfinished construction site with no visible roof, siding, windows, foundation, structure, HVAC, or landscaping. Significant repairs and improvements are needed to bring the home to a livable condition.
Repairs flagged
- Major roof — The independent satellite image shows a large, unfinished construction site with no visible roof.
- Major exterior/siding — The independent satellite image shows a large, unfinished construction site with no visible siding.
- Major windows — The independent satellite image shows a large, unfinished construction site with no visible windows.
- Major foundation/structure — The independent satellite image shows a large, unfinished construction site with no visible foundation or structure.
- Major HVAC/mechanicals — The independent satellite image shows a large, unfinished construction site with no visible HVAC or mechanical systems.
- Major landscaping/curb appeal — The independent satellite image shows a large, unfinished construction site with no visible landscaping or curb appeal.
Value-add opportunities
- Both roof — A new roof would significantly improve the home's appearance and functionality.
- Both exterior/siding — New siding would enhance the home's curb appeal and protect the structure.
- Both windows — New windows would improve energy efficiency and increase the home's value.
- Both foundation/structure — Stabilizing the foundation and structure would ensure the home's long-term stability.
- Both HVAC/mechanicals — Upgrading the HVAC and mechanical systems would improve comfort and energy efficiency.
- Both landscaping/curb appeal — Landscaping and curb appeal improvements would enhance the home's overall appearance and value.
Renovation cost estimate screening
| Repair item | Severity | Est. cost |
|---|---|---|
| roof · The independent satellite image shows a large, unfinished construction site with no visible roof. | Major | $15,000–50,000 |
| exterior/siding · The independent satellite image shows a large, unfinished construction site with no visible siding. | Major | $15,000–50,000 |
| windows · The independent satellite image shows a large, unfinished construction site with no visible windows. | Major | $15,000–50,000 |
| foundation/structure · The independent satellite image shows a large, unfinished construction site with no visible foundation or structure. | Major | $15,000–50,000 |
| HVAC/mechanicals · The independent satellite image shows a large, unfinished construction site with no visible HVAC or mechanical systems. | Major | $15,000–50,000 |
| landscaping/curb appeal · The independent satellite image shows a large, unfinished construction site with no visible landscaping or curb appeal. | Major | $15,000–50,000 |
| Total estimated repair cost · 6 items | $90,000–300,000 |
Value-add ROI direction
- Both roof — A new roof would significantly improve the home's appearance and functionality. ↑
- Both exterior/siding — New siding would enhance the home's curb appeal and protect the structure. ↑
- Both windows — New windows would improve energy efficiency and increase the home's value. ↑
- Both foundation/structure — Stabilizing the foundation and structure would ensure the home's long-term stability. ↑
- Both HVAC/mechanicals — Upgrading the HVAC and mechanical systems would improve comfort and energy efficiency. ↑
- Both landscaping/curb appeal — Landscaping and curb appeal improvements would enhance the home's overall appearance and value. ↑
ⓘ Cost ranges are severity-bucket heuristics (US national rule-of-thumb). Get contractor quotes + a written scope before underwriting a rehab budget.
Schools (NCES district)
- District
- Redlands Unified
- NCES district ID
- 0632070
- Math proficiency
- 44% ▼ -1.00%
- Reading proficiency
- 57% ▼ -2.00%
- Median HH income
- $67,959
- Composite
- 46.88/100
- National rank
- #5185
- State rank
- #390 of 1400 in CA
Livability — Redlands
- Score
- 75/100
- State rank
- #118
- US rank
- #4193
Category grades
Schools grade is shown separately in the Schools card above.
Census & demographics
- Census place
- Redlands, CA
- County
- San Bernardino County · 2,030,291 people
- City population
- 80,519
- Metro
- Riverside-San Bernardino-Ontario, CA
- Population (ZIP)
- 45,262
- Household income
- $102,813
- Rent vs Own
- Severe rent burden
- 1176.0
Population outlook (San Bernardino County) Hauer SSP2
- Today (2025)
- 2,300,329 people
- By 2030
- 2,378,907 · +3.4%
- By 2040
- 2,523,137 · +9.7%
- By 2050
- 2,642,388 · +14.9%
- By 2075
- 2,880,769 · +25.2%
- By 2100
- 2,909,436 · +26.5%
Race, ethnicity, and origin ACS 2023
- Neighborhood character
- Diverse neighborhood (Simpson 0.67)
- Race & ethnicity
- Hispanic / Latino 43% White 37% Two or more races 19% Asian 8% Black 6% Pacific Islander 1%
- Hispanic origin (detail)
- Mexican 37%
- Common ancestry
- Italian 2% Lithuanian 2% Slovak 1%
- Foreign-born
- 18% · Canada, China, Vietnam
- Languages at home
- 67% English-only · Spanish 24% Other Indo-European 2% Other Asian/Pacific 2%
Political lean MEDSL · San Bernardino
- 2024 margin
- Toss-up / Even · D 47.5% · R 49.7% · Other 2.8%
- 2008→2024 swing
- -8.5pp toward R · 2008: 6.3pp · 2024: -2.1pp
- All cycles
- 2024: R+2.1 2020: D+10.7 2016: D+9.8 2012: D+5.4 2008: D+6.3
Not yet ingested
- Civics
- —
Market trends
- HPI YoY
- ▼ -425.72%
- Current HPI
- 367.6123
- Rent YoY
- ▲ 3.73%
- Metro
- Riverside-San Bernardino-Ontario, CA
- State GDP YoY
- ▲ 3.21%
- F500 in state
- 116
Industry mix (Fortune 500 HQ in CA)
| Industry | F500 HQs | Revenue |
|---|---|---|
| Technology | 27 | $1,492B |
|
||
| Financial Services | 3 | $174B |
|
||
| Retail | 3 | $44B |
|
||
| Insurance | 3 | $26B |
|
||
| Media / Entertainment | 2 | $115B |
|
||
| Pharmaceuticals / Biotech | 2 | $62B |
|
||
Cash-flow waterfall
monthlySold comps — $/sqft
last 12 mo · ≤1 miLoading sold comps…