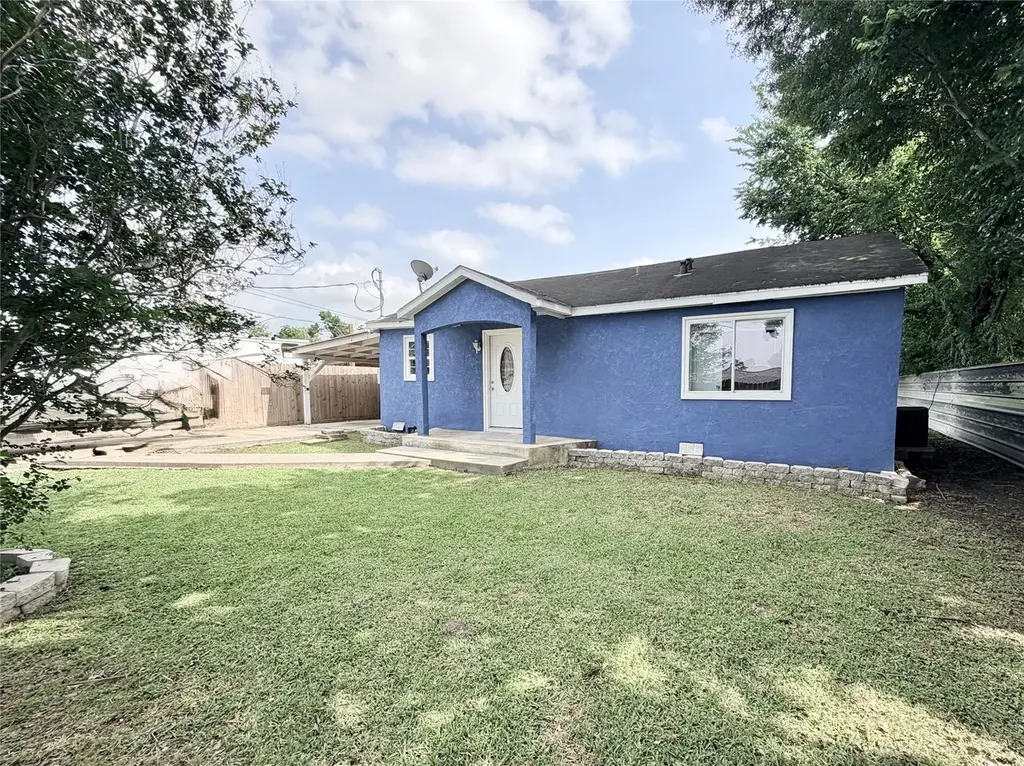
12906 Gladden Dr
Houston, TX 77049
$178,500D
3 bd · 2.0 ba ·
944 sqft ·
Built 1971
· Manufactured
· Active
· 52 DOM
Cashflow @ list (25.0% down · 7.5%)
Estimated rent
$1,462/mo
Mortgage (P&I)
−$936
Tax + insurance
−$260
HOA
−$0
Vac / Maint / Mgmt
−$307
Net cashflow
$-41/mo
Annual
$-496/yr
Cap rate
6.01%
Cash-on-cash
-0.99%
DSCR
0.96
1% rule
0.82%
Cash to close
$49,980
Investor read
- This is a 3-bed/2.0-bath manufactured listed at $178k. Condition is rated good.
- At list price, monthly cash flow is $-41 ($-496/yr) — negative.
- To cash-flow at today's rent, offer at most $171k (4.1% below list).
- To meet the 1% rule (rent ≥ 1% of price), the offer needs to be $146k (18.1% below list).
- It's been on market 52 days — a 3% lower offer ($173k) is reasonable based on typical stale-listing flexibility.
- Recommended offer: $146k (18.1% below list) — sets the bar for 1% rule.
- Local home prices are declining (-1.2%/yr); year-one equity from $1k of loan paydown is wiped out by about $2k of value loss. Plan a longer hold.
- Location reads 74/100 on livability (#184 in TX, #4,771 nationally) — a middle-class / working-renter tenant base. Strengths: amenities A+, cost of living A+, housing A+; Watch: crime F.
- Sheldon ISD (suburban): math 19% / reading 25% proficiency, ranked #746 of 826 in TX (top 90%) — low school quality limits family demand, transient renter base, plan for 1-2y turnover; 72% free/reduced lunch — lower-income household profile, screen leases tightly.
- Zoned schools: Royalwood El (math 33% / reading 33%, grade F, #2,208 of 4,322 statewide, top 52%, 554 students, 89% FRL); C E King Middle (math 13% / reading 24%, grade F, #1,478 of 1,662 statewide, top 90%, 1,311 students, 90% FRL); C E King H S (math 19% / reading 30%, grade F, #1,264 of 1,632 statewide, top 82%, 3,473 students, 82% FRL) — zoned schools average 87% FRL vs 72% district-wide (15 pts higher); higher-poverty schools than district average — tighter screening recommended.
- Market conditions: Rents falling (-3.3%/yr); 159 active listings in the ZIP; 9 comparable units currently listed for rent nearby; rentals leasing fast (median 12d on market — plan ~1-2 weeks tenant-placement turnaround); 29,883 units permitted in Harris County in 2024 (8,621 in 5+ unit buildings).
- Harris County population projected at +47% by 2050 — long-run rental-demand tailwind backs the buy-and-hold thesis.
- 2 sale attempts with the ask held roughly flat each time — persistent listings suggest the price (not the market) is what's stuck; bring a comps-based counter.
- Cap rate 6.0% vs local median 3.2% in Houston — top-decile yield for the area; either an underpriced asset or a hidden risk that comps aren't pricing in. Stress-test before assuming the spread holds.
Questions for listing agent
- What do current leases actually rent for vs. the listed asking? Can we see a recent rent roll and the last 12 months of T-12 income?
- It's been on market 52 days. Have you received any prior offers? Is the seller open to a 18% concession, seller financing, or rate buy-down credit?
- Built in 1971 — when were the roof, HVAC, electrical panel, plumbing, and water heater last replaced?
- Is there a deadline driving the sale (1031 exchange, divorce, estate, relocation)? That informs how much negotiation room exists.
- Schools are D-rated, which usually means shorter tenancies and higher turnover. Who's the typical renter profile here, and what's been the actual vacancy rate?
- Crime grade is F in this area — have there been break-ins, vandalism, or insurance claims at this property in the last 3 years? What carrier currently insures it and at what premium?
- The area grade is low — what's the realistic commute time and amenity access for the typical tenant pool here? Any planned neighborhood developments (good or bad) we should know about?
- What's the average days-on-market for RENTAL listings here right now (not sales)? A rising rental-DOM trend means longer vacancies and softer asking-rent achievability than the comps imply.
CashFlowRE · CFR-4GR8H9AV7EWAYH
· Data 1 day ago
cashflowre.app · 2026-05-29