12906 Gladden Dr · Houston, TX
Flood risk No data
- FEMA flood zone
- —
- Chance of flooding over 30 yrs
- —
- Est. flood insurance / yr
- —
Fire risk No data
- Est. fire insurance / yr
- —
Heat risk No data
- Hot days now (above threshold)
- —
- Hot days in 30 yrs
- —
Wind risk No data
- Chance of severe wind over 30 yrs
- —
Air-quality risk No data
- Unhealthy air days now
- —
- Unhealthy air days in 30 yrs
- —
Risk factors via First Street. Map © Google.
Why this score? — see what drove the D grade
The composite is a weighted blend of 9 inputs, each scored 0–100. Each bar is that input's sub-score; the figure is the points it added to the 100-point composite (weight × sub-score).
- Cash flow +12.0/30.0
- ARV discount +10.2/15.0
- Appreciation +4.4/10.0
- Condition / age +4.0/5.0
- Livability +3.7/5.0
- DSCR +3.6/10.0
- 1% rule +3.2/10.0
- Schools +2.0/10.0
- Rent growth +1.7/5.0
$178,500
🖨 Deal sheet (PDF) 📄 Offer letter ✓ Due diligence
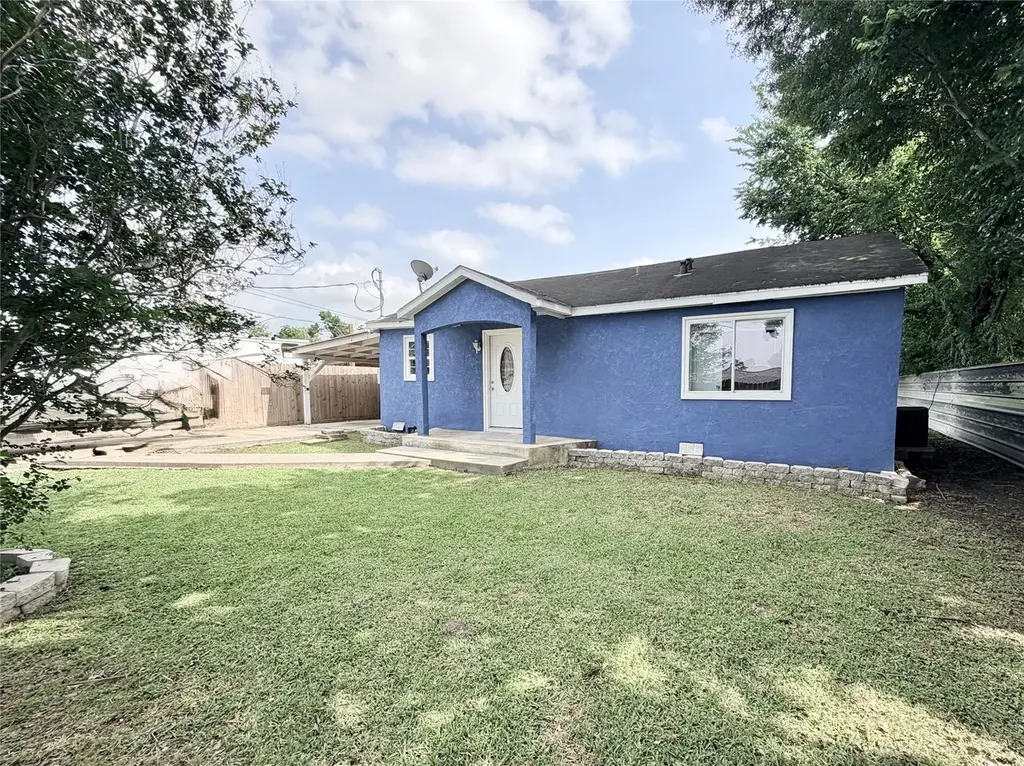
Listing remarks
Step into a refreshed and easy living 2 bedroom home designed for comfort and simplicity. Freshly painted throughout the home, . The open floor concept layout creates a bright, airy flow giving a great open space. Each bedroom offers generous space and natural light, making it ideal for relaxing at the end of the day. Enjoy everyday convenience with central HVAC and washer/dryer connections already in place. HUGE backyard adds even more value, perfect for quiet mornings or casual gatherings.
Key facts
- Central hvac
- Open floor concept
- Huge backyard
Tags
Property features AI
Finance
- Other: Seller disclosure available
Exterior
- Parking: Attached carport; Detached carport; 2-space carport
- Utilities: Public water; Public sewer
- Home design: Residential property; Built in 1971; Entry on slab foundation
- Construction: Cement siding; Composition roof; Slab foundation
- Exterior features: Private yard; Cleared lot; Located in a subdivision; Asphalt road access
Interior
- Kitchen: Dishwasher; Electric oven; Garbage disposal
- Bedrooms: 2 possible bedrooms
- Bathrooms: 1 full bathroom
- Heating & cooling: Central heating (electric); Central air conditioning (electric)
- Interior features: Breakfast bar; Kitchen open to family room
Neighborhood map
What this means for you Summary
Snapshot
- This is a 3-bed/2.0-bath manufactured listed at $178k. Condition is rated good.
Deal economics
- At list price, monthly cash flow is $-41 ($-496/yr) — negative.
- To cash-flow at today's rent, offer at most $171k (4.1% below list).
- To meet the 1% rule (rent ≥ 1% of price), the offer needs to be $146k (18.1% below list).
- Recommended offer: $146k (18.1% below list) — sets the bar for 1% rule.
- Cap rate 6.0% vs local median 3.2% in Houston — top-decile yield for the area; either an underpriced asset or a hidden risk that comps aren't pricing in. Stress-test before assuming the spread holds.
Location & tenants
- Location reads 74/100 on livability (#184 in TX, #4,771 nationally) — a middle-class / working-renter tenant base. Strengths: amenities A+, cost of living A+, housing A+; Watch: crime F.
- Sheldon ISD (suburban): math 19% / reading 25% proficiency, ranked #746 of 826 in TX (top 90%) — low school quality limits family demand, transient renter base, plan for 1-2y turnover; 72% free/reduced lunch — lower-income household profile, screen leases tightly.
- Zoned schools: Royalwood El (math 33% / reading 33%, grade F, #2,208 of 4,322 statewide, top 52%, 554 students, 89% FRL); C E King Middle (math 13% / reading 24%, grade F, #1,478 of 1,662 statewide, top 90%, 1,311 students, 90% FRL); C E King H S (math 19% / reading 30%, grade F, #1,264 of 1,632 statewide, top 82%, 3,473 students, 82% FRL) — zoned schools average 87% FRL vs 72% district-wide (15 pts higher); higher-poverty schools than district average — tighter screening recommended.
- Market conditions: Rents falling (-3.3%/yr); 159 active listings in the ZIP; 9 comparable units currently listed for rent nearby; rentals leasing fast (median 12d on market — plan ~1-2 weeks tenant-placement turnaround); 29,883 units permitted in Harris County in 2024 (8,621 in 5+ unit buildings).
Forward outlook
- Local home prices are declining (-1.2%/yr); year-one equity from $1k of loan paydown is wiped out by about $2k of value loss. Plan a longer hold.
- Harris County population projected at +47% by 2050 — long-run rental-demand tailwind backs the buy-and-hold thesis.
Negotiation context
- It's been on market 52 days — a 3% lower offer ($173k) is reasonable based on typical stale-listing flexibility.
- 2 sale attempts with the ask held roughly flat each time — persistent listings suggest the price (not the market) is what's stuck; bring a comps-based counter.
Questions for the listing agent
- What do current leases actually rent for vs. the listed asking? Can we see a recent rent roll and the last 12 months of T-12 income?
- It's been on market 52 days. Have you received any prior offers? Is the seller open to a 18% concession, seller financing, or rate buy-down credit?
- Built in 1971 — when were the roof, HVAC, electrical panel, plumbing, and water heater last replaced?
- Is there a deadline driving the sale (1031 exchange, divorce, estate, relocation)? That informs how much negotiation room exists.
- Schools are D-rated, which usually means shorter tenancies and higher turnover. Who's the typical renter profile here, and what's been the actual vacancy rate?
- Crime grade is F in this area — have there been break-ins, vandalism, or insurance claims at this property in the last 3 years? What carrier currently insures it and at what premium?
- The area grade is low — what's the realistic commute time and amenity access for the typical tenant pool here? Any planned neighborhood developments (good or bad) we should know about?
- What's the average days-on-market for RENTAL listings here right now (not sales)? A rising rental-DOM trend means longer vacancies and softer asking-rent achievability than the comps imply.
- What's the recent tenant-quality profile in this submarket — average credit score on applications, eviction rate, late-payment / NSF rate, and stable-employment percentage? A property-management company in the area should have these aggregated.
- How much new for-sale + rental construction is in the pipeline within 1–3 miles? Heavy new supply typically softens prices + rents 12–24 months out; constrained supply supports both.
Investment metrics
- 1% rule
- 0.82% ✗
- Cap rate
- 6.01%
- Cash-on-cash
- -0.99%
- DSCR
- 0.96
- GRM
- 10.2
CMA / ARV
- ARV (median comp)
- $189,811
- List price
- $178,500
- Delta
- -5.96%
- Verdict
- FAIR
- Comps
- 20 within 1.0 mi
Projected returns pro-forma
-1.2% appreciation · 0.0% rent growth · sell at horizon
- IRR
- -10.6%
- Equity multiple
- 0.56×
- Total profit
- $-21,997
- Equity at exit
- $41,345
- IRR
- -6.5%
- Equity multiple
- 0.47×
- Total profit
- $-26,240
- Equity at exit
- $41,948
Cash invested: $49,980 (down + closing). Projections, not guarantees.
Landlord ↔ Tenant lean methodology
- Overall (STATE)
- 87 Strongly Landlord-Friendly
- State Texas
- 87 Strongly Landlord-Friendly · R+5
- County
- — inherits STATE
- City
- — inherits STATE
ZIP-level market 77049
- Home prices YoY
- -0.5%
- Rents YoY
- -3.3%
- Active inventory
- 159
- Price-to-rent
- 10.2×
Monthly cashflow live
- Estimated rent
- $1,462 high interval (Pro) →
- Mortgage (P&I)
- −$936
- Tax from tax record
- −$186 /mo · $2,228/yr
- Insurance
- −$74
- HOA
- −$0
- Vacancy / Maint / Mgmt
- −$307
- Net cashflow
- $-41
Break-even live
Sensitivity live
| Price | -10% $60 | -5% $9 | +0% $-41 | +5% $-92 | +10% $-142 |
|---|---|---|---|---|---|
| Rent | -10% $-157 | -5% $-99 | +0% $-41 | +5% $16 | +10% $74 |
| Rate | -1.0pp $49 | -0.5pp $4 | base $-41 | +0.5pp $-88 | +1.0pp $-135 |
UW: 25.0% down · 7.5% · 30yr · 1.5% tax · 5.0% vac · 8.0% maint · 8.0% mgmt
Financing live
Cash to close
- Down payment
- $44,625
- Closing costs
- $5,355
- Reserves months
- —
- Total cash needed
- —
Loan-product check · same deal, 3 products live
Conventional
25% down · 7.5% · 30yr
- Down + closing
- —
- Monthly P&I
- —
- Monthly cashflow
- —
- DSCR
- —
- Eligible?
- —
Personal DTI + credit; lowest rate.
DSCR
20% down · 8.5% · 30yr
- Down + closing
- —
- Monthly P&I
- —
- Monthly cashflow
- —
- DSCR
- —
- Eligible?
- —
No personal income docs; deal must DSCR.
Hard money
10% down · 12.0% · 12mo
- Down + closing
- —
- Monthly P&I
- —
- Monthly cashflow
- —
- DSCR
- —
- Eligible?
- —
Short-term bridge; refi at stabilization.
Rent comps 9 comps
| Address | Beds | Baths | Sqft | Rent | $/sqft | DOM | Units | Dist |
|---|---|---|---|---|---|---|---|---|
| 6415 S Lake Houston Pkwy Unit Plan C Houston, TX | 2.0 | 2.0 | 980 | $1,225 | $1.25 | 45d | 1 | 0.82mi |
| 5830 S Lake Houston Pkwy Unit 2165 Houston, TX | 2.0 | 2.0 | 863 | $1,073 | $1.24 | 1d | 1 | 1.11mi |
| 5830 S Lake Houston Pkwy Unit 2162 Houston, TX | 2.0 | 2.0 | 863 | $1,089 | $1.26 | 6d | 1 | 1.11mi |
| 5830 S Lake Houston Pkwy Unit 5887 Houston, TX | 2.0 | 2.0 | 863 | $1,113 | $1.29 | 12d | 1 | 1.12mi |
| 7100 Uvalde Rd Houston, TX | 1.0–3.0 | 1.0–2.0 | 1066 | $2,229 | $2.09 | 0d | 16 | 1.25mi |
| 5836 S Lake Houston Pkwy Houston, TX | 3.0 | 2.0 | 1052 | $1,289 | $1.23 | 24d | 1 | 1.34mi |
| 5836 S Lake Houston Pkwy Houston, TX | 2.0 | 2.0 | 954 | $1,094 | $1.15 | 20d | 1 | 1.34mi |
| 5836 S Lake Houston Pkwy Houston, TX | 3.0 | 2.0 | 1052 | $1,289 | $1.23 | 45d | 1 | 1.34mi |
| 7110 New Forest Pkwy Houston, TX | 1.0–2.0 | 1.0–2.0 | 951 | $1,725 | $1.81 | 0d | 20 | 1.41mi |
Listing history 18 events
-
2026-06-21days on market $178,500 Active 52 DOM
-
2026-06-18days on market $178,500 Active 49 DOM
-
2026-06-17days on market $178,500 Active 48 DOM
-
2026-06-16days on market $178,500 Active 47 DOM
-
2026-06-15days on market $178,500 Active 46 DOM
-
2026-06-13days on market $178,500 Active 44 DOM
-
2026-06-09days on market $178,500 Active 40 DOM
-
2026-06-08days on market $178,500 Active 39 DOM
-
2026-06-07days on market $178,500 Active 38 DOM
-
2026-06-04days on market $178,500 Active 35 DOM
-
2026-06-03days on market $178,500 Active 34 DOM
-
2026-06-02days on market $178,500 Active 33 DOM
-
2026-06-01days on market $178,500 Active 32 DOM
-
2026-05-31days on market $178,500 Active 31 DOM
-
2026-04-30$178,500 Active 495-char remark
-
2026-04-26historical $1,750
-
2026-03-11$1,750
-
2024-05-09soldstatus
ⓘ Source: listings_history table (triggers on properties + properties_extension) + one-shot
backfill from property_details.listing_events for pre-trigger history.
Tax reassessment forecast TX · Resets to sale price
- Current annual tax
- $2,228 · $186/mo
- Projected year-2 tax
- $3,267 · $272/mo
- Expected delta
- +$1,039/yr (+$87/mo · 46.6%)
ⓘ Screening estimate from a state-policy table — verify with the county assessor before closing.
Nearby sold comps map
Loading sold comps map…
Walkable amenities ~0.75 mi
Loading nearby amenities…
Taxation est. · year 1
- Rental income
- $17,540
- − Mortgage interest
- −$9,999
- − Property taxes
- −$2,228
- − Insurance
- −$892
- − Repairs & maintenance
- −$1,403
- − Management
- −$1,403
- − Depreciation
- −$5,193
- Taxable loss
- −$3,578
- Est. tax savings @ 24.0%
- +$859
- After-tax cash flow
- $362/yr
For passive investors: Depreciation is non-cash, so a rental often shows a tax loss while cash-flowing — sheltering income. Rental losses are passive: they offset passive income freely, and up to $25,000/yr can offset ordinary (W-2) income if you actively participate and your MAGI is under $100k (phasing out to $0 by $150k); unused losses carry forward. On sale, claimed depreciation is recaptured at up to 25%, and gains may owe capital-gains tax (a 1031 exchange can defer both). Figures are a year-1 estimate at your 24.0% rate — not tax advice; consult a CPA.
Condition & rehab AI · 11 photos
This home is in good condition with recent updates, including new flooring, cabinets, and paint. The large backyard adds significant value and potential for rental income.
Value-add opportunities
- Both landscaping — enhances curb appeal and adds value
- Both painting — fresh paint improves curb appeal and interior aesthetics
- Both landscaping — landscaping enhances curb appeal and adds value
Renovation cost estimate screening
Value-add ROI direction
- Both landscaping — enhances curb appeal and adds value ↑
- Both painting — fresh paint improves curb appeal and interior aesthetics ↑
- Both landscaping — landscaping enhances curb appeal and adds value ↑
ⓘ Cost ranges are severity-bucket heuristics (US national rule-of-thumb). Get contractor quotes + a written scope before underwriting a rehab budget.
Schools (NCES district)
- District
- Sheldon ISD
- NCES district ID
- 4839990
- Math proficiency
- 19% ▼ -18.00%
- Reading proficiency
- 25% ▼ -10.00%
- Median HH income
- $49,443
- Composite
- 19.5/100
- National rank
- #8772
- State rank
- #746 of 826 in TX
Livability — Houston
- Score
- 74/100
- State rank
- #184
- US rank
- #4771
Category grades
Schools grade is shown separately in the Schools card above.
Census & demographics
- County
- Harris County · 4,702,590 people
- City population
- 3,226,434
- Metro
- Houston-The Woodlands-Sugar Land, TX
- Population (ZIP)
- 40,418
- Household income
- $62,971
- Rent vs Own
- Severe rent burden
- 993.0
Population outlook (Harris County) Hauer SSP2
- Today (2025)
- 5,571,493 people
- By 2030
- 6,089,821 · +9.3%
- By 2040
- 7,142,806 · +28.2%
- By 2050
- 8,185,864 · +46.9%
- By 2075
- 10,574,329 · +89.8%
- By 2100
- 12,109,958 · +117.4%
Race, ethnicity, and origin ACS 2023
- Neighborhood character
- Predominantly Hispanic (66%)
- Race & ethnicity
- Hispanic / Latino 66% Two or more races 32% Black 19% White 10% Asian 3%
- Hispanic origin (detail)
- Mexican 55%
- Common ancestry
- Lithuanian 1%
- Foreign-born
- 26% · Canada, China, Vietnam
- Languages at home
- 43% English-only · Spanish 54% Other Asian/Pacific 1% Chinese 1%
Political lean MEDSL · Harris
- 2024 margin
- Lean D (+5.5) · D 52.0% · R 46.4% · Other 1.6%
- 2008→2024 swing
- +3.9pp toward D · 2008: 1.6pp · 2024: 5.5pp
- All cycles
- 2024: D+5.5 2020: D+13.3 2016: D+12.4 2012: D+0.1 2008: D+1.6
Not yet ingested
- Civics
- —
Market trends
- HPI YoY
- ▼ -1.20%
- Current HPI
- 248.1111
- Rent YoY
- ▼ -3.31%
- Metro
- Houston-The Woodlands-Sugar Land, TX
- State GDP YoY
- ▲ 3.95%
- F500 in state
- 110
Industry mix (Fortune 500 HQ in TX)
| Industry | F500 HQs | Revenue |
|---|---|---|
| Energy | 16 | $1,198B |
|
||
| Technology | 5 | $198B |
|
||
| Engineering / Construction | 4 | $72B |
|
||
| Energy Services | 3 | $60B |
|
||
| Utilities | 3 | $41B |
|
||
| Healthcare | 2 | $330B |
|
||
Price history
+10100.0% since first listed4 events — show timeline
- 2026-04-30 Listed $178,500 HARMLS
- 2026-04-26 Rental Removed $1,750 HARMLS
- 2026-03-11 Listed for Rent $1,750 HARMLS
- 2024-05-09 Sold (Public Records) — Public Records
Property tax history
+122.5%/yrLatest (2025): $2,228 · +122.5% YoY. Source: county tax records.
Cash-flow waterfall
monthlySold comps — $/sqft
last 12 mo · ≤1 miLoading sold comps…