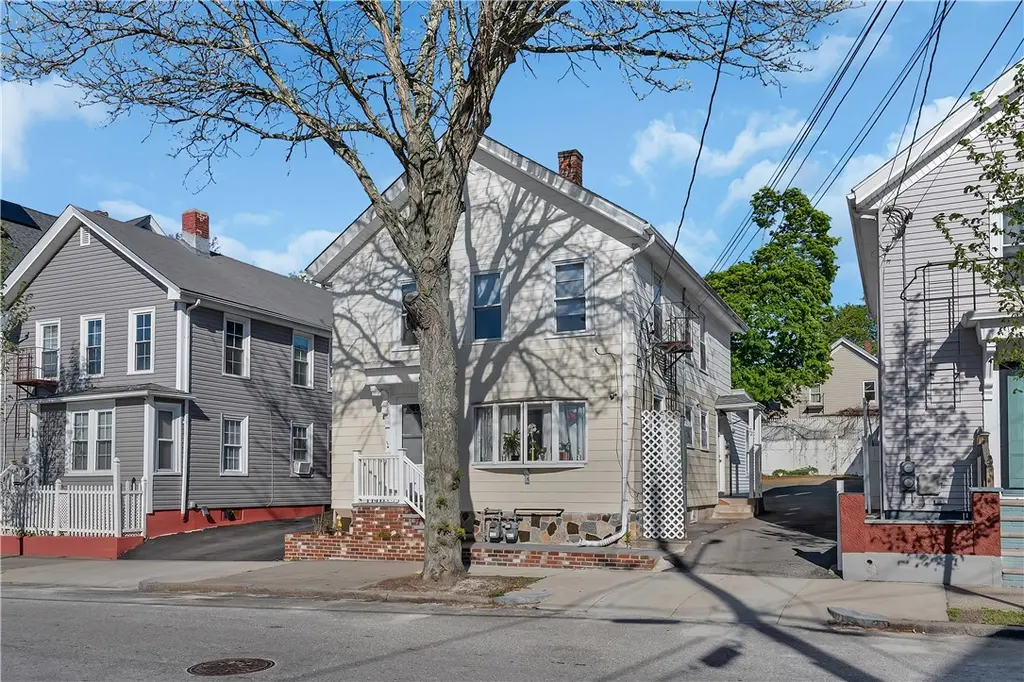
72 Moore St
Central Falls, RI 02863
$539,000D
4 bd · 3.0 ba ·
2,420 sqft ·
Built 1900
· MultiFamily
· Pending
· 11 DOM
Cashflow @ list (25.0% down · 7.5%)
Estimated rent
$3,505/mo
Mortgage (P&I)
−$2,827
Tax + insurance
−$605
HOA
−$0
Vac / Maint / Mgmt
−$736
Net cashflow
$-662/mo
Annual
$-7,946/yr
Cap rate
4.82%
Cash-on-cash
-5.27%
DSCR
0.77
1% rule
0.65%
Cash to close
$150,920
Investor read
- This is a 2 × 2-bed/1.0-bath units multifamily listed at $539k.
- At list price, monthly cash flow is $-662 ($-8k/yr) — negative. Per door: $-331/mo.
- To cash-flow at today's rent, offer at most $422k (21.7% below list).
- To meet the 1% rule (rent ≥ 1% of price), the offer needs to be $350k (35.0% below list).
- Only 11 days on market — expect competitive offers; lowballing is unlikely to land.
- Recommended offer: $350k (35.0% below list) — sets the bar for 1% rule.
- In year one you build about $28k of equity ($4k loan paydown + $25k appreciation (4.6% local appreciation)).
- Location reads 66/100 on livability (#21 in RI) — a middle-class / working-renter tenant base. Strengths: health & safety A+, cost of living A, housing B; Watch: schools F, amenities F, commute F.
- Central Falls (suburban): math 2% / reading 8% proficiency, ranked #38 of 39 in RI (top 97%) — low school quality limits family demand, transient renter base, plan for 1-2y turnover; 78% free/reduced lunch — lower-income household profile, screen leases tightly.
- Watch-outs: built in 1900 — expect roof / HVAC / electrical / plumbing capex.
- Market conditions: 33 active listings in the ZIP; 3 comparable units currently listed for rent nearby; rentals leasing fast (median 5d on market — plan ~1-2 weeks tenant-placement turnaround); 776 units permitted in Providence County in 2024 (229 in 5+ unit buildings).
- Providence County population projected at +5% by 2050 — modest demand growth; plan on rents tracking national, not racing it.
- 8 sale attempts since 23y ago with the ask held roughly flat each time — persistent listings suggest the price (not the market) is what's stuck; bring a comps-based counter.
- By year 2, paydown + projected appreciation supports a ~$46k cash-out refi (75% LTV) — recoverable capital for the next deal without selling this one.
- Climate carrying-cost: major wind risk, 70% chance of damaging wind over 30y; extreme-heat days projected 7→15/yr by 2055 (HVAC capex compounding) — expect insurance premiums to compound above CPI over the hold.
- At $3,505/mo this rent would consume 85% of the median local household income ($49k/yr) (locally 1380% of renters already pay >50% of income on rent) — very limited rent-growth headroom before tenants either downsize or default.
Questions for listing agent
- What do current leases actually rent for vs. the listed asking? Can we see a recent rent roll and the last 12 months of T-12 income?
- Can we see the unit-by-unit rent roll, current vacancy, and any below-market leases? What's the average tenancy length?
- What capital expenditures (roof, boiler, parking lot, exteriors) have been made in the last 5 years, and what's planned in the next 2?
- Built in 1900 — when were the roof, HVAC, electrical panel, plumbing, and water heater last replaced?
- Is there a deadline driving the sale (1031 exchange, divorce, estate, relocation)? That informs how much negotiation room exists.
- Schools are F-rated, which usually means shorter tenancies and higher turnover. Who's the typical renter profile here, and what's been the actual vacancy rate?
- The area grade is low — what's the realistic commute time and amenity access for the typical tenant pool here? Any planned neighborhood developments (good or bad) we should know about?
- What's the average days-on-market for RENTAL listings here right now (not sales)? A rising rental-DOM trend means longer vacancies and softer asking-rent achievability than the comps imply.
CashFlowRE · CFR-4HCT73AZ4JS4F2
· Data 3 weeks ago
cashflowre.app · 2026-05-29