 Duplex
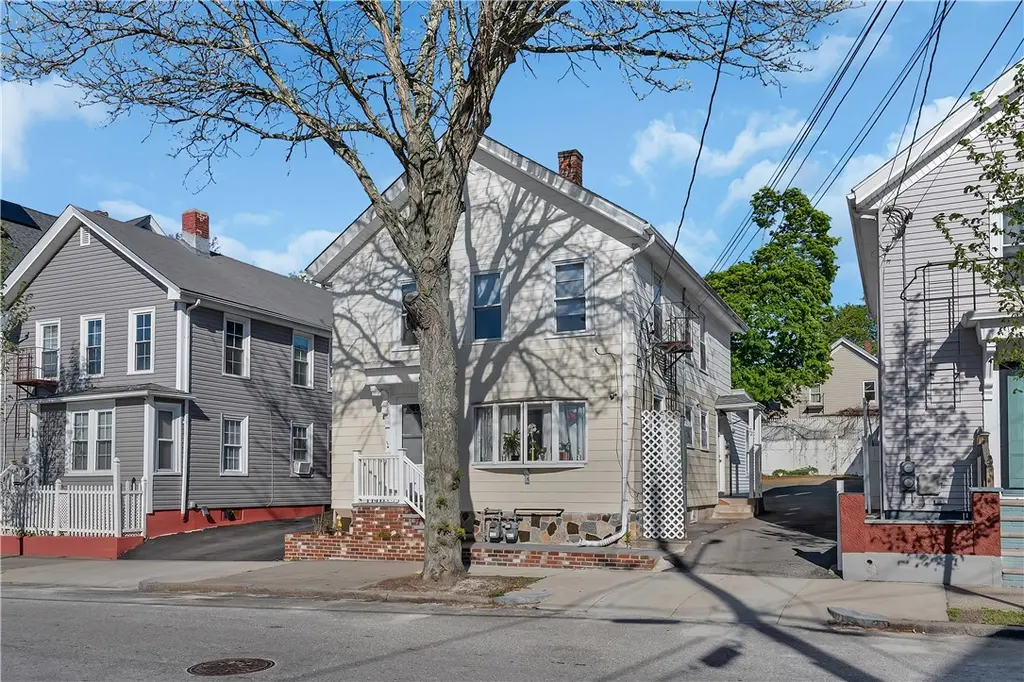
72 Moore St · Central Falls, RI
Flood risk 1/10 · Minimal
- FEMA flood zone
- X (unshaded)
- Chance of flooding over 30 yrs
- 0.0%
- Est. flood insurance / yr
- $473 – $860
Fire risk 1/10 · Minimal
- Est. fire insurance / yr
- $835 – $1,551
Heat risk 6/10 · Moderate
- Hot days now (above 96°F)
- 7 days/yr
- Hot days in 30 yrs
- 15 days/yr
Wind risk 6/10 · Moderate
- Chance of severe wind over 30 yrs
- 70.0%
Air-quality risk 2/10 · Minimal
- Unhealthy air days now
- 1 days/yr
- Unhealthy air days in 30 yrs
- 2 days/yr
Risk factors via First Street. Map © Google.
Why this score? — see what drove the D grade
The composite is a weighted blend of 9 inputs, each scored 0–100. Each bar is that input's sub-score; the figure is the points it added to the 100-point composite (weight × sub-score).
- ARV discount +14.0/15.0
- Cash flow +7.5/30.0
- Appreciation +7.3/10.0
- Livability +3.3/5.0
- Rent growth +2.5/5.0
- Condition / age +2.5/5.0
- DSCR +1.7/10.0
- 1% rule +1.5/10.0
- Schools +0.4/10.0
$539,000
🖨 Deal sheet 📄 Offer letter ✓ Due diligence
Multi-family units
County records classify this as Multi-Family (2-4 Unit). Listing-text estimate: 2 units. confirmed
Listing remarks MLS
Highest & Best offers due 9/9, Monday at 6pm. Please check disclosures for solar information. I will have complete info on the contract for solar panels this week.
Key facts
- Off street parking
- Two family residence
- Move in ready
Tags
Property features AI
Finance
- HOA & community: Community features include highway access, nearby schools, public transportation, restaurants and shopping
Exterior
- Parking: No garage; Space for 5 vehicles
- Utilities: Public water connected; Public sewer connected; Electric service: 100 amp with circuit breakers
- Home design: Two-story multifamily building; Single building with two units; Above-grade finished area approximately 2,420 sq ft
- Construction: Vinyl siding; Drywall interior
- Exterior features: R2 zoning; Lot approximately 3,485 sq ft
Interior
- Kitchen: Oven; Range; Microwave; Dishwasher; Refrigerator
- Bedrooms: One 2-bedroom unit; One 3-bedroom unit
- Flooring: Hardwood; Ceramic tile; Vinyl
- Bathrooms: Two full bathrooms (one in each unit)
- Heating & cooling: Gas heating; Baseboard hot water/steam heating
- Interior features: Attic; Stall shower; Has basement with interior entry; partially finished
- Laundry & utility: Washer and dryer; Common area laundry; Gas water heater
Neighborhood map
What this means for you Summary
Snapshot
- This is a 2 × 2-bed/1.0-bath units multifamily listed at $539k.
Deal economics
- At list price, monthly cash flow is $-662 ($-8k/yr) — negative. Per door: $-331/mo.
- To cash-flow at today's rent, offer at most $422k (21.7% below list).
- To meet the 1% rule (rent ≥ 1% of price), the offer needs to be $350k (35.0% below list).
- Recommended offer: $350k (35.0% below list) — sets the bar for 1% rule.
Location & tenants
- Location reads 66/100 on livability (#21 in RI) — a middle-class / working-renter tenant base. Strengths: health & safety A+, cost of living A, housing B; Watch: schools F, amenities F, commute F.
- Central Falls (suburban): math 2% / reading 8% proficiency, ranked #38 of 39 in RI (top 97%) — low school quality limits family demand, transient renter base, plan for 1-2y turnover; 78% free/reduced lunch — lower-income household profile, screen leases tightly.
- Market conditions: 33 active listings in the ZIP; 3 comparable units currently listed for rent nearby; rentals leasing fast (median 4d on market — plan ~1-2 weeks tenant-placement turnaround); 776 units permitted in Providence County in 2024 (229 in 5+ unit buildings).
- At $3,505/mo this rent would consume 85% of the median local household income ($49k/yr) (locally 1380% of renters already pay >50% of income on rent) — very limited rent-growth headroom before tenants either downsize or default.
Forward outlook
- In year one you build about $28k of equity ($4k loan paydown + $25k appreciation (4.6% local appreciation)).
- Providence County population projected at +5% by 2050 — modest demand growth; plan on rents tracking national, not racing it.
- By year 2, paydown + projected appreciation supports a ~$46k cash-out refi (75% LTV) — recoverable capital for the next deal without selling this one.
Negotiation context
- Only 11 days on market — expect competitive offers; lowballing is unlikely to land.
- 8 sale attempts since 23y ago with the ask held roughly flat each time — persistent listings suggest the price (not the market) is what's stuck; bring a comps-based counter.
Risks & watch-outs
- Watch-outs: built in 1900 — expect roof / HVAC / electrical / plumbing capex.
- Climate carrying-cost: major wind risk, 70% chance of damaging wind over 30y; extreme-heat days projected 7→15/yr by 2055 (HVAC capex compounding) — expect insurance premiums to compound above CPI over the hold.
Questions for the listing agent
- What do current leases actually rent for vs. the listed asking? Can we see a recent rent roll and the last 12 months of T-12 income?
- Can we see the unit-by-unit rent roll, current vacancy, and any below-market leases? What's the average tenancy length?
- What capital expenditures (roof, boiler, parking lot, exteriors) have been made in the last 5 years, and what's planned in the next 2?
- Built in 1900 — when were the roof, HVAC, electrical panel, plumbing, and water heater last replaced?
- Is there a deadline driving the sale (1031 exchange, divorce, estate, relocation)? That informs how much negotiation room exists.
- Schools are F-rated, which usually means shorter tenancies and higher turnover. Who's the typical renter profile here, and what's been the actual vacancy rate?
- The area grade is low — what's the realistic commute time and amenity access for the typical tenant pool here? Any planned neighborhood developments (good or bad) we should know about?
- What's the average days-on-market for RENTAL listings here right now (not sales)? A rising rental-DOM trend means longer vacancies and softer asking-rent achievability than the comps imply.
- What's the recent tenant-quality profile in this submarket — average credit score on applications, eviction rate, late-payment / NSF rate, and stable-employment percentage? A property-management company in the area should have these aggregated.
- How much new apartment / multifamily construction is in the pipeline within 1–3 miles? Heavy new supply (>2% of stock underway) typically softens rents 12–24 months out; light construction supports rent growth.
Investment metrics
- 1% rule
- 0.65% ✗
- Cap rate
- 4.82%
- Cash-on-cash
- -5.27%
- DSCR
- 0.77
- GRM
- 12.8
CMA / ARV
- ARV (median comp)
- $630,591
- List price
- $539,000
- Delta
- -14.52%
- Verdict
- UNDERPRICED
- Comps
- 20 within 1.0 mi
Show comp detail 7 sales within ~0.75 mi
| Address | Dist | Beds/Ba | Sqft | Sold | Price | $/sf | Match |
|---|---|---|---|---|---|---|---|
| 72 Moore St | 0.00mi | 5/3.0 (+1) | 2,400 (-1%) | 20mo | $500,000 | $208 | 77 |
| 140 Valley St | 0.25mi | 4/2.0 | 2,302 (-5%) | 13mo | $495,000 | $215 | 65 |
| 66 Aetna St | 0.44mi | 5/4.0 (+1) | 2,576 (+6%) | 10mo | $580,000 | $225 | 51 |
| 30 Sumner St | 0.54mi | 4/2.0 | 2,340 (-3%) | 22mo | $450,000 | $192 | 46 |
| 22 Pacific St | 0.65mi | 5/2.5 (+1) | 2,689 (+11%) | 9mo | $470,000 | $175 | 37 |
| 13 15 Chestnut Ave | 0.70mi | 4/2.0 | 2,205 (-9%) | 19mo | $565,000 | $256 | 32 |
| 1032 Smithfield Ave | 0.74mi | 5/2.5 (+1) | 2,143 (-11%) | 12mo | $655,000 | $306 | 29 |
Match score weights: distance 35% · size 25% · config 20% · recency 20%. Top-matched comps best support the ARV.
Projected returns pro-forma
4.58% appreciation · 3.0% rent growth · sell at horizon
- IRR
- 7.3%
- Equity multiple
- 1.46×
- Total profit
- $68,931
- Equity at exit
- $291,618
- IRR
- 9.4%
- Equity multiple
- 2.66×
- Total profit
- $251,157
- Equity at exit
- $492,217
Cash invested: $150,920 (down + closing). Projections, not guarantees.
Landlord ↔ Tenant lean methodology
- Overall (STATE)
- 31 Tenant-Leaning
- State Rhode Island
- 31 Tenant-Leaning · D+8
- County
- — inherits STATE
- City
- — inherits STATE
ZIP-level market 02863
- Home prices YoY
- 1.2%
- Active inventory
- 33
- Price-to-rent
- 25.6×
Monthly cashflow live
- Estimated rent
- $3,505 high interval (Pro) →
- Mortgage (P&I)
- −$2,827
- Tax from tax record
- −$380 /mo · $4,560/yr
- Insurance
- −$225
- HOA
- −$0
- Vacancy / Maint / Mgmt
- −$736
- Net cashflow
- $-662
Break-even live
2-unit breakdown (identical units grouped — click to expand)
| Units | Beds | Baths | Est. rent |
|---|---|---|---|
| 2× units | 2 | 1 | $3,506 |
| #1 | 2 | 1 | $1,753 |
| #2 | 2 | 1 | $1,753 |
| Total (2 units) | $3,505 | ||
UW: 25.0% down · 7.5% · 30yr · 1.5% tax · 5.0% vac · 8.0% maint · 8.0% mgmt
Financing live
Cash to close
- Down payment
- $134,750
- Closing costs
- $16,170
- Reserves months
- —
- Total cash needed
- —
Loan-product check · same deal, 3 products live
Conventional
25% down · 7.5% · 30yr
- Down + closing
- —
- Monthly P&I
- —
- Monthly cashflow
- —
- DSCR
- —
- Eligible?
- —
Personal DTI + credit; lowest rate.
DSCR
20% down · 8.5% · 30yr
- Down + closing
- —
- Monthly P&I
- —
- Monthly cashflow
- —
- DSCR
- —
- Eligible?
- —
No personal income docs; deal must DSCR.
Hard money
10% down · 12.0% · 12mo
- Down + closing
- —
- Monthly P&I
- —
- Monthly cashflow
- —
- DSCR
- —
- Eligible?
- —
Short-term bridge; refi at stabilization.
Rent comps 3 comps
| Address | Beds | Baths | Sqft | Rent | $/sqft | DOM | Units | Dist |
|---|---|---|---|---|---|---|---|---|
| 53 Hadwin St Unit 2 Central Falls, RI | 3.0 | 1.0 | 2800 | $2,150 | $0.77 | 4d | 1 | 0.73mi |
| 46 Mary St Pawtucket, RI | 3.0 | 2.0 | 1600 | $2,250 | $1.41 | 43d | 1 | 1.14mi |
| 40 Olney Ave Lincoln, RI | 4.0 | 3.0 | 2443 | $3,600 | $1.47 | 1d | 1 | 1.38mi |
Listing history 23 events
-
2026-05-16status Pending 826-char remark
-
2026-05-13status Active 826-char remark
-
2026-05-11status Pending 826-char remark
-
2026-05-04$539,000 Active 826-char remark
-
2024-10-15soldstatus $500,000 Closed 169-char remark
Show marketing remark (169 chars)
Highest & Best offers due 9/9, Monday at 6pm. Please check disclosures for solar information. I will have complete info on the contract for solar panels this week.
-
2024-09-12status Pending 169-char remark
Show marketing remark (169 chars)
Highest & Best offers due 9/9, Monday at 6pm. Please check disclosures for solar information. I will have complete info on the contract for solar panels this week.
-
2024-09-03$450,000 Active 169-char remark
Show marketing remark (169 chars)
Highest & Best offers due 9/9, Monday at 6pm. Please check disclosures for solar information. I will have complete info on the contract for solar panels this week.
-
2019-09-20price $154,900
Show marketing remark (131 chars)
GREAT HOME ALL REDONE READY TO OCCUPY. NICE KITCHEN AND LARGE MODERN BATHROOM. HAS 2 FAMILY ZONING HAS BEEN USED AS A SINGLE FAMILY
-
2017-11-01soldstatus $180,000 Sold
-
2017-10-31soldstatus $180,000
-
2017-08-03status Pending
-
2017-03-20$189,000 Active
-
2016-11-08price $245,000
-
2007-01-11historical
-
2006-08-29$299,000
-
2005-09-08historical
-
2005-04-19$249,900
-
2004-02-27soldstatus $165,000
-
2004-02-26soldstatus $164,900
Show marketing remark (131 chars)
GREAT HOME ALL REDONE READY TO OCCUPY. NICE KITCHEN AND LARGE MODERN BATHROOM. HAS 2 FAMILY ZONING HAS BEEN USED AS A SINGLE FAMILY
-
2004-02-05historical
Show marketing remark (131 chars)
GREAT HOME ALL REDONE READY TO OCCUPY. NICE KITCHEN AND LARGE MODERN BATHROOM. HAS 2 FAMILY ZONING HAS BEEN USED AS A SINGLE FAMILY
-
2004-01-14historical
-
2003-12-19$164,900
Show marketing remark (131 chars)
GREAT HOME ALL REDONE READY TO OCCUPY. NICE KITCHEN AND LARGE MODERN BATHROOM. HAS 2 FAMILY ZONING HAS BEEN USED AS A SINGLE FAMILY
-
2003-10-01$164,900
ⓘ Source: listings_history table (triggers on properties + properties_extension) + one-shot
backfill from property_details.listing_events for pre-trigger history.
Tax reassessment forecast RI · Partial reset (capped growth)
- Current annual tax
- $4,560 · $380/mo
- Projected year-2 tax
- $6,673 · $556/mo
- Expected delta
- +$2,113/yr (+$176/mo · 46.3%)
ⓘ Screening estimate from a state-policy table — verify with the county assessor before closing.
Climate risk First Street
- Flood 1/10 Low FEMA zone X (unshaded) · 0% chance over 30 yrs
- Wildfire 1/10 Low
- Heat 6/10 Major 7 d/yr ≥96°F today · 15 d/yr by 30 yrs out
- Wind 6/10 Major 70% chance of damaging wind over 30 yrs
- Air quality 2/10 Low 1 unhealthy d/yr today · 2 by 30 yrs out
Nearby sold comps map
Loading sold comps map…
Walkable amenities ~0.75 mi
Loading nearby amenities…
Taxation est. · year 1
- Rental income
- $42,060
- − Mortgage interest
- −$30,192
- − Property taxes
- −$4,560
- − Insurance
- −$2,695
- − Repairs & maintenance
- −$3,365
- − Management
- −$3,365
- − Depreciation
- −$15,680
- Taxable loss
- −$17,797
- Est. tax savings @ 24.0%
- +$4,271
- After-tax cash flow
- $-3,675/yr
For passive investors: Depreciation is non-cash, so a rental often shows a tax loss while cash-flowing — sheltering income. Rental losses are passive: they offset passive income freely, and up to $25,000/yr can offset ordinary (W-2) income if you actively participate and your MAGI is under $100k (phasing out to $0 by $150k); unused losses carry forward. On sale, claimed depreciation is recaptured at up to 25%, and gains may owe capital-gains tax (a 1031 exchange can defer both). Figures are a year-1 estimate at your 24.0% rate — not tax advice; consult a CPA.
Schools (NCES district)
- District
- Central Falls
- NCES district ID
- 4400120
- Math proficiency
- 2% ▼ -6.00%
- Reading proficiency
- 8% ▼ -5.00%
- Median HH income
- $30,478
- Composite
- 3.59/100
- National rank
- #10071
- State rank
- #38 of 39 in RI
Livability — Central Falls
- Score
- 66/100
- State rank
- #21
- US rank
- #11321
Category grades
Schools grade is shown separately in the Schools card above.
Census & demographics
- Census place
- Central Falls, RI
- County
- Providence County · 548,917 people
- City population
- 22,701
- Metro
- Providence-Warwick, RI-MA
- Population (ZIP)
- 22,701
- Household income
- $49,285
- Rent vs Own
- Severe rent burden
- 1380.0
Population outlook (Providence County) Hauer SSP2
- Today (2025)
- 653,469 people
- By 2030
- 660,819 · +1.1%
- By 2040
- 672,747 · +3.0%
- By 2050
- 683,741 · +4.6%
- By 2075
- 720,435 · +10.2%
- By 2100
- 741,582 · +13.5%
Race, ethnicity, and origin ACS 2023
- Neighborhood character
- Predominantly Hispanic (69%)
- Race & ethnicity
- Hispanic / Latino 69% Two or more races 29% White 16% Black 8%
- Hispanic origin (detail)
- Mexican 6% Puerto Rican 15% Dominican 7%
- Common ancestry
- Lithuanian 4% Russian 4% Romanian 1%
- Foreign-born
- 40% · Canada, Jamaica
- Languages at home
- 29% English-only · Spanish 62% Other Indo-European 5% French/Haitian/Cajun 3%
Political lean MEDSL · Providence
- 2024 margin
- D (+14.4) · D 56.1% · R 41.7% · Other 2.2%
- 2008→2024 swing
- -20.0pp toward R · 2008: 34.4pp · 2024: 14.4pp
- All cycles
- 2024: D+14.4 2020: D+22.9 2016: D+21.2 2012: D+34.9 2008: D+34.4
Not yet ingested
- Civics
- —
Market trends
- HPI YoY
- ▲ 4.58%
- Current HPI
- 373.2598
- Rent YoY
- —
- Metro
- Providence-Warwick, RI-MA
- State GDP YoY
- ▲ 2.25%
- F500 in state
- 10
Industry mix (Fortune 500 HQ in RI)
| Industry | F500 HQs | Revenue |
|---|---|---|
| Healthcare | 1 | $373B |
|
||
| Food Distribution | 1 | $31B |
|
||
| Aerospace / Defense | 1 | $14B |
|
||
| Financial Services | 1 | $8B |
|
||
| Consumer Goods | 1 | $4B |
|
||
Price history
+226.9% since first listed24 events — show timeline
- 2026-05-16 Pending — RIS
- 2026-05-16 Listing Removed — RIS
- 2026-05-13 Relisted — RIS
- 2026-05-11 Pending — RIS
- 2026-05-04 Listed $539,000 RIS
- 2024-10-15 Sold (MLS) $500,000 RIS
- 2024-09-12 Pending — RIS
- 2024-09-03 Listed $450,000 RIS
- 2019-09-20 Price Changed $154,900 RIS
- 2017-11-01 Sold (MLS) $180,000 RIS
- 2017-10-31 Sold (Public Records) $180,000 Public Records
- 2017-08-03 Pending — RIS
- 2017-03-20 Listed $189,000 RIS
- 2016-11-08 Price Changed $245,000 RIS
- 2007-01-11 Listing Removed — RIS
- 2006-08-29 Listed $299,000 RIS
- 2005-09-08 Listing Removed — RIS
- 2005-04-19 Listed $249,900 RIS
- 2004-02-27 Sold (Public Records) $165,000 Public Records
- 2004-02-26 Sold (MLS) $164,900 RIS
- 2004-02-05 Listing Removed — RIS
- 2004-01-14 Listing Removed — RIS
- 2003-12-19 Listed $164,900 RIS
- 2003-10-01 Listed $164,900 RIS
Property tax history
+5.8%/yrLatest (2025): $4,560 · +7.3% YoY. Source: county tax records.
Cash-flow waterfall
monthlySold comps — $/sqft
last 12 mo · ≤1 miLoading sold comps…