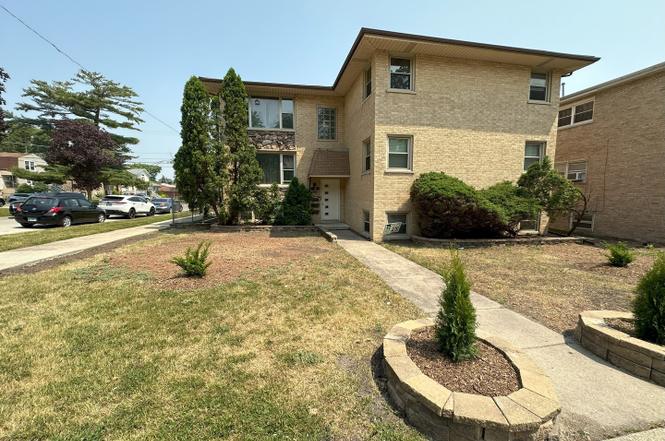
6520 W Gunnison St
Harwood Heights, IL 60706
$889,900D
9 bd · 4.5 ba ·
4,646 sqft ·
Built 1985
· MultiFamily
· Active
· 376 DOM
Cashflow @ list (25.0% down · 7.5%)
Estimated rent
$8,014/mo
Mortgage (P&I)
−$4,667
Tax + insurance
−$1,584
HOA
−$0
Vac / Maint / Mgmt
−$1,683
Net cashflow
$80/mo
Annual
$962/yr
Cap rate
6.40%
Cash-on-cash
0.39%
DSCR
1.02
1% rule
0.90%
Cash to close
$249,172
Investor read
- This is a 3 × 3-bed/1.5-bath units multifamily listed at $890k.
- At list price, monthly cash flow is $80 ($962/yr) — positive. Per door: $27/mo.
- The deal already cash-flows at list — no discount required.
- To meet the 1% rule (rent ≥ 1% of price), the offer needs to be $801k (9.9% below list).
- It's been on market 376 days — a 12% lower offer ($783k) is reasonable based on typical stale-listing flexibility.
- Recommended offer: $783k (12.0% below list) — sets the bar for market timing.
- Local home prices are declining (-3.0%/yr); year-one equity from $6k of loan paydown is wiped out by about $27k of value loss. Plan a longer hold.
- Location reads 87/100 on livability (#13 in IL, #302 nationally) — a professional / high-income tenant draw. Strengths: amenities A+, commute A+, housing A+.
- Ridgewood Chsd 234 (suburban): math 18% / reading 30% proficiency, ranked #314 of 620 in IL (top 51%) — low school quality limits family demand, transient renter base, plan for 1-2y turnover.
- Zoned schools: Ridgewood Comm High School (math 18% / reading 30%, grade F, #304 of 693 statewide, top 44%, 873 students, 0% FRL).
- Market conditions: 42 active listings in the ZIP; solid renter incomes; 6,272 units permitted in Cook County in 2024 (4,658 in 5+ unit buildings).
- 7 sale attempts since 5y ago with the ask held roughly flat each time — persistent listings suggest the price (not the market) is what's stuck; bring a comps-based counter.
- Current owner paid $310k; list at $890k implies a 187% gain — meaningful room to come down on a strong offer.
- Cap rate 6.4% vs local median 3.8% in Harwood Heights — top-decile yield for the area; either an underpriced asset or a hidden risk that comps aren't pricing in. Stress-test before assuming the spread holds.
- At $8,014/mo this rent would consume 114% of the median local household income ($85k/yr) (locally 561% of renters already pay >50% of income on rent) — very limited rent-growth headroom before tenants either downsize or default.
Questions for listing agent
- It's been on market 376 days. Have you received any prior offers? Is the seller open to a 12% concession, seller financing, or rate buy-down credit?
- Can we see the unit-by-unit rent roll, current vacancy, and any below-market leases? What's the average tenancy length?
- What capital expenditures (roof, boiler, parking lot, exteriors) have been made in the last 5 years, and what's planned in the next 2?
- Why hasn't it sold? Are there any deal-killer items the seller is aware of (foundation, flood, title, zoning, code violations)?
- Is there a deadline driving the sale (1031 exchange, divorce, estate, relocation)? That informs how much negotiation room exists.
- The area grade is low — what's the realistic commute time and amenity access for the typical tenant pool here? Any planned neighborhood developments (good or bad) we should know about?
- What's the average days-on-market for RENTAL listings here right now (not sales)? A rising rental-DOM trend means longer vacancies and softer asking-rent achievability than the comps imply.
- What's the recent tenant-quality profile in this submarket — average credit score on applications, eviction rate, late-payment / NSF rate, and stable-employment percentage? A property-management company in the area should have these aggregated.
CashFlowRE · CFR-4HKPPE2CYFS8HW
· Data 3 days ago
cashflowre.app · 2026-05-29