 Triplex
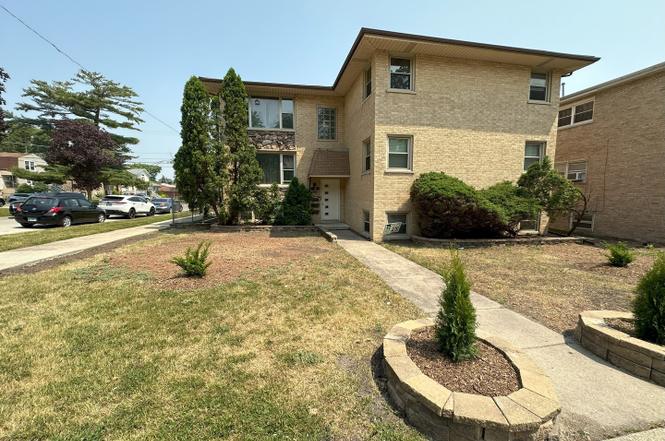
6520 W Gunnison St · Harwood Heights, IL
Flood risk 1/10 · Minimal
- FEMA flood zone
- X (unshaded)
- Chance of flooding over 30 yrs
- 0.0%
- Est. flood insurance / yr
- $473 – $860
Fire risk 1/10 · Minimal
- Est. fire insurance / yr
- $804 – $1,492
Heat risk 3/10 · Minor
- Hot days now (above 99°F)
- 7 days/yr
- Hot days in 30 yrs
- 14 days/yr
Wind risk 2/10 · Minimal
- Chance of severe wind over 30 yrs
- 0.0%
Air-quality risk 4/10 · Minor
- Unhealthy air days now
- 6 days/yr
- Unhealthy air days in 30 yrs
- 7 days/yr
Risk factors via First Street. Map © Google.
Why this score? — see what drove the D grade
The composite is a weighted blend of 9 inputs, each scored 0–100. Each bar is that input's sub-score; the figure is the points it added to the 100-point composite (weight × sub-score).
- Cash flow +13.8/30.0
- ARV discount +7.5/15.0
- Livability +4.4/5.0
- DSCR +4.2/10.0
- 1% rule +4.0/10.0
- Rent growth +2.5/5.0
- Condition / age +2.5/5.0
- Schools +2.2/10.0
- Appreciation +0.0/10.0
$889,900
🖨 Deal sheet 📄 Offer letter ✓ Due diligence
Multi-family units
County records classify this as Multi-Family (2-4 Unit). Listing-text estimate: 3 units. confirmed
Listing remarks
This truly unique, all brick, legal 3-unit building on a corner lot situated across the street from the golf course of Ridgemoor Country Club is the perfect investment or for the owner occupied buyer. Building is fully occupied with long term, paying tenants and has room to significantly increase the rents. Each unit has three bedrooms, 1.1 baths (with the potential to make the 1/2 bath into a full bath in each unit), living room, dining room area and eat-in kitchen. Upper two units have balconies. Appliances included are refrigerator, stove with hood and dishwasher. Units have laundry hook up. Tenants supply their own washer/dryer. All units are separately metered for gas and electric and
Key facts
- Dining room area
- Living room
- All brick
Tags
Property features AI
Finance
- Other: Commuter bus access nearby; Building not listed as built before 1978; Property type suitable for investors (multi-unit)
- Financial info: Gross income reported at $67,260; Common expenses listed: water/sewer, trash, electric, insurance (details available); Water/sewer expense: $4,000; Trash expense: $4,000; Electric expense: $250; Insurance expense: $2,200
- HOA & community: Community features include park, tennis courts, sidewalks, street lights, and paved streets
Exterior
- Parking: 8 parking spaces total; Assigned and unassigned parking; owned spaces
- Utilities: Water source: Lake Michigan; Public sewer
- Home design: Two- to four-unit property; 3 units in building; Fee simple ownership; Rehab completed in 2011; 31–40 years old
- Construction: Brick construction
- Exterior features: Balcony; Outdoor grill; Fenced yard (partial chain link); Corner, level lot; Lot dimensions approximately 57 x 125
Interior
- Kitchen: Stove; Refrigerator; Dishwasher; Range hood
- Bedrooms: 9 bedrooms total; Each of the three units has 3 bedrooms
- Flooring: Hardwood floors in each unit
- Bathrooms: 3 full bathrooms in building; 3 half bathrooms in building; Each unit has 2 bathrooms (1 full, 1 half)
- Heating & cooling: Natural gas forced-air heating; Central air conditioning in each unit
- Interior features: 18 total rooms; Screens on windows; Multiple water heaters; Soaking tub
- Laundry & utility: Laundry hook-ups in each unit; Multiple water heaters
Neighborhood map
What this means for you Summary
Snapshot
- This is a 3 × 3-bed/2.0-bath units multifamily listed at $890k.
Deal economics
- At list price, monthly cash flow is $80 ($962/yr) — positive. Per door: $27/mo.
- The deal already cash-flows at list — no discount required.
- To meet the 1% rule (rent ≥ 1% of price), the offer needs to be $801k (9.9% below list).
- Recommended offer: $783k (12.0% below list) — sets the bar for market timing.
- Cap rate 6.4% vs local median 3.8% in Harwood Heights — top-decile yield for the area; either an underpriced asset or a hidden risk that comps aren't pricing in. Stress-test before assuming the spread holds.
Location & tenants
- Location reads 87/100 on livability (#13 in IL, #302 nationally) — a professional / high-income tenant draw. Strengths: amenities A+, commute A+, housing A+.
- Ridgewood Chsd 234 (suburban): math 18% / reading 30% proficiency, ranked #314 of 620 in IL (top 51%) — low school quality limits family demand, transient renter base, plan for 1-2y turnover.
- Zoned schools: Ridgewood Comm High School (math 18% / reading 30%, grade F, #304 of 693 statewide, top 44%, 873 students, 0% FRL).
- Market conditions: 42 active listings in the ZIP; solid renter incomes; 6,272 units permitted in Cook County in 2024 (4,658 in 5+ unit buildings).
- At $8,014/mo this rent would consume 114% of the median local household income ($85k/yr) (locally 561% of renters already pay >50% of income on rent) — very limited rent-growth headroom before tenants either downsize or default.
Forward outlook
- Local home prices are declining (-3.0%/yr); year-one equity from $6k of loan paydown is wiped out by about $27k of value loss. Plan a longer hold.
Negotiation context
- It's been on market 376 days — a 12% lower offer ($783k) is reasonable based on typical stale-listing flexibility.
- 7 sale attempts since 5y ago with the ask held roughly flat each time — persistent listings suggest the price (not the market) is what's stuck; bring a comps-based counter.
- Current owner paid $310k; list at $890k implies a 187% gain — meaningful room to come down on a strong offer.
Questions for the listing agent
- It's been on market 376 days. Have you received any prior offers? Is the seller open to a 12% concession, seller financing, or rate buy-down credit?
- Can we see the unit-by-unit rent roll, current vacancy, and any below-market leases? What's the average tenancy length?
- What capital expenditures (roof, boiler, parking lot, exteriors) have been made in the last 5 years, and what's planned in the next 2?
- Why hasn't it sold? Are there any deal-killer items the seller is aware of (foundation, flood, title, zoning, code violations)?
- Is there a deadline driving the sale (1031 exchange, divorce, estate, relocation)? That informs how much negotiation room exists.
- The area grade is low — what's the realistic commute time and amenity access for the typical tenant pool here? Any planned neighborhood developments (good or bad) we should know about?
- What's the average days-on-market for RENTAL listings here right now (not sales)? A rising rental-DOM trend means longer vacancies and softer asking-rent achievability than the comps imply.
- What's the recent tenant-quality profile in this submarket — average credit score on applications, eviction rate, late-payment / NSF rate, and stable-employment percentage? A property-management company in the area should have these aggregated.
- How much new apartment / multifamily construction is in the pipeline within 1–3 miles? Heavy new supply (>2% of stock underway) typically softens rents 12–24 months out; light construction supports rent growth.
Investment metrics
- 1% rule
- 0.90% ✗
- Cap rate
- 6.40%
- Cash-on-cash
- 0.39%
- DSCR
- 1.02
- GRM
- 9.3
CMA / ARV
No comps found within radius.
Projected returns pro-forma
-3.0% appreciation · 3.0% rent growth · sell at horizon
- IRR
- -15.7%
- Equity multiple
- 0.44×
- Total profit
- $-138,913
- Equity at exit
- $132,687
- IRR
- -7.2%
- Equity multiple
- 0.54×
- Total profit
- $-113,645
- Equity at exit
- $76,942
Cash invested: $249,172 (down + closing). Projections, not guarantees.
Landlord ↔ Tenant lean methodology
- Overall (STATE)
- 43 Moderately Tenant-Leaning
- State Illinois
- 43 Moderately Tenant-Leaning · D+7
- County
- — inherits STATE
- City
- — inherits STATE
ZIP-level market 60706
- Active inventory
- 42
- Price-to-rent
- 27.8×
Monthly cashflow live
- Estimated rent
- $8,014 high interval (Pro) →
- Mortgage (P&I)
- −$4,667
- Tax from tax record
- −$1,213 /mo · $14,560/yr
- Insurance
- −$371
- HOA
- −$0
- Vacancy / Maint / Mgmt
- −$1,683
- Net cashflow
- $80
Break-even live
3-unit breakdown (identical units grouped — click to expand)
| Units | Beds | Baths | Est. rent |
|---|---|---|---|
| 3× units | 3 | 2 | $8,013 |
| #1 | 3 | 2 | $2,671 |
| #2 | 3 | 2 | $2,671 |
| #3 | 3 | 2 | $2,671 |
| Total (3 units) | $8,014 | ||
UW: 25.0% down · 7.5% · 30yr · 1.5% tax · 5.0% vac · 8.0% maint · 8.0% mgmt
Financing live
Cash to close
- Down payment
- $222,475
- Closing costs
- $26,697
- Reserves months
- —
- Total cash needed
- —
Loan-product check · same deal, 3 products live
Conventional
25% down · 7.5% · 30yr
- Down + closing
- —
- Monthly P&I
- —
- Monthly cashflow
- —
- DSCR
- —
- Eligible?
- —
Personal DTI + credit; lowest rate.
DSCR
20% down · 8.5% · 30yr
- Down + closing
- —
- Monthly P&I
- —
- Monthly cashflow
- —
- DSCR
- —
- Eligible?
- —
No personal income docs; deal must DSCR.
Hard money
10% down · 12.0% · 12mo
- Down + closing
- —
- Monthly P&I
- —
- Monthly cashflow
- —
- DSCR
- —
- Eligible?
- —
Short-term bridge; refi at stabilization.
Listing history 32 events
-
2026-06-18days on market $889,900 Active 376 DOM
-
2026-06-17days on market $889,900 Active 375 DOM
-
2026-06-16days on market $889,900 Active 374 DOM
-
2026-06-15days on market $889,900 Active 373 DOM
-
2026-06-13days on market $889,900 Active 371 DOM
-
2026-06-13days on market $889,900 Active 370 DOM
-
2026-06-09days on market $889,900 Active 367 DOM
-
2026-06-08days on market $889,900 Active 366 DOM
-
2026-06-07days on market $889,900 Active 365 DOM
-
2026-06-04days on market $889,900 Active 362 DOM
-
2026-06-03days on market $889,900 Active 361 DOM
-
2026-06-02days on market $889,900 Active 360 DOM
-
2026-06-01days on market $889,900 Active 359 DOM
-
2026-05-31days on market $889,900 Active 358 DOM
-
2026-02-13status Active
-
2026-01-02status Pending
-
2025-04-28status Temporarily No Showings
-
2025-04-11historical
-
2025-04-09$889,900 Active
-
2025-02-06historical Contingent - Continue to Show
-
2025-02-05historical
-
2024-03-01Active
-
2024-03-01historical
-
2023-05-03Active
-
2023-05-03historical
-
2022-05-16Active
-
2022-05-16historical
-
2021-11-08price
-
2021-07-02New
-
1991-06-21soldstatus $310,000
-
1984-07-01soldstatus $205,000
-
1984-03-06soldstatus $48,000
ⓘ Source: listings_history table (triggers on properties + properties_extension) + one-shot
backfill from property_details.listing_events for pre-trigger history.
Tax reassessment forecast IL · Partial reset (capped growth)
- Current annual tax
- $14,560 · $1,213/mo
- Projected year-2 tax
- $17,381 · $1,448/mo
- Expected delta
- +$2,820/yr (+$235/mo · 19.4%)
ⓘ Screening estimate from a state-policy table — verify with the county assessor before closing.
Climate risk First Street
- Flood 1/10 Low FEMA zone X (unshaded) · 0% chance over 30 yrs
- Wildfire 1/10 Low
- Heat 3/10 Moderate 7 d/yr ≥99°F today · 14 d/yr by 30 yrs out
- Wind 2/10 Low 0% chance of damaging wind over 30 yrs
- Air quality 4/10 Moderate 6 unhealthy d/yr today · 7 by 30 yrs out
Nearby sold comps map
Loading sold comps map…
Walkable amenities ~0.75 mi
Loading nearby amenities…
Taxation est. · year 1
- Rental income
- $96,168
- − Mortgage interest
- −$49,848
- − Property taxes
- −$14,560
- − Insurance
- −$4,450
- − Repairs & maintenance
- −$7,693
- − Management
- −$7,693
- − Depreciation
- −$25,888
- Taxable loss
- −$13,965
- Est. tax savings @ 24.0%
- +$3,352
- After-tax cash flow
- $4,314/yr
For passive investors: Depreciation is non-cash, so a rental often shows a tax loss while cash-flowing — sheltering income. Rental losses are passive: they offset passive income freely, and up to $25,000/yr can offset ordinary (W-2) income if you actively participate and your MAGI is under $100k (phasing out to $0 by $150k); unused losses carry forward. On sale, claimed depreciation is recaptured at up to 25%, and gains may owe capital-gains tax (a 1031 exchange can defer both). Figures are a year-1 estimate at your 24.0% rate — not tax advice; consult a CPA.
Schools (NCES district)
- District
- Ridgewood Chsd 234
- NCES district ID
- 1733720
- Math proficiency
- 18% ▼ -2.00%
- Reading proficiency
- 30% ▼ -1.00%
- Median HH income
- $60,254
- Composite
- 22.16/100
- National rank
- #8168
- State rank
- #314 of 620 in IL
Livability — Harwood Heights
- Score
- 87/100
- State rank
- #13
- US rank
- #302
Category grades
Schools grade is shown separately in the Schools card above.
Census & demographics
- Census place
- Harwood Heights, IL
- County
- Cook County · 4,486,803 people
- City population
- 24,260
- Metro
- Chicago-Naperville-Elgin, IL-IN-WI
- Population (ZIP)
- 24,260
- Household income
- $84,530
- Rent vs Own
- Severe rent burden
- 561.0
Population outlook (Cook County) Hauer SSP2
- Today (2025)
- 5,347,519 people
- By 2030
- 5,357,703 · +0.2%
- By 2040
- 5,324,924 · -0.4%
- By 2050
- 5,230,762 · -2.2%
- By 2075
- 4,785,735 · -10.5%
- By 2100
- 4,188,836 · -21.7%
Race, ethnicity, and origin ACS 2023
- Neighborhood character
- Predominantly White (73%)
- Race & ethnicity
- White 73% Hispanic / Latino 16% Asian 8% Two or more races 5% Black 1%
- Hispanic origin (detail)
- Mexican 8% Puerto Rican 3%
- Common ancestry
- Romanian 26% Subsaharan African 2% American 1%
- Foreign-born
- 41% · Canada, Vietnam
- Languages at home
- 40% English-only · Russian/Polish/Slavic 32% Spanish 10% Other Indo-European 8%
Political lean MEDSL · Cook
- 2024 margin
- Solid D (+42.0) · D 70.4% · R 28.4% · Other 1.2%
- 2008→2024 swing
- -11.4pp toward R · 2008: 53.4pp · 2024: 42.0pp
- All cycles
- 2024: D+42.0 2020: D+50.3 2016: D+53.0 2012: D+49.4 2008: D+53.4
Not yet ingested
- Civics
- —
Market trends
- HPI YoY
- ▼ -197.33%
- Current HPI
- 174.6965
- Rent YoY
- —
- Metro
- Chicago-Naperville-Elgin, IL-IN-WI
- State GDP YoY
- ▲ 1.59%
- F500 in state
- 60
Industry mix (Fortune 500 HQ in IL)
| Industry | F500 HQs | Revenue |
|---|---|---|
| Insurance | 4 | $201B |
|
||
| Consumer Goods | 4 | $87B |
|
||
| Industrial Machinery | 3 | $64B |
|
||
| Healthcare | 2 | $55B |
|
||
| Retail / Pharmacy | 1 | $148B |
|
||
| Agriculture / Food | 1 | $86B |
|
||
Price history
+1754.0% since first listed18 events — show timeline
- 2026-02-13 Relisted — MRED as Distributed by MLS Grid
- 2026-01-02 Pending — MRED as Distributed by MLS Grid
- 2025-04-28 Relisted — MRED as Distributed by MLS Grid
- 2025-04-11 Listing Removed — MRED as Distributed by MLS Grid
- 2025-04-09 Listed $889,900 MRED as Distributed by MLS Grid
- 2025-02-06 Contingent — MRED as Distributed by MLS Grid
- 2025-02-05 Listing Removed — MRED as Distributed by MLS Grid
- 2024-03-01 Listing Removed — MRED as Distributed by MLS Grid
- 2024-03-01 Listed — MRED as Distributed by MLS Grid
- 2023-05-03 Listing Removed — MRED as Distributed by MLS Grid
- 2023-05-03 Listed — MRED as Distributed by MLS Grid
- 2022-05-16 Listing Removed — MRED as Distributed by MLS Grid
- 2022-05-16 Listed — MRED as Distributed by MLS Grid
- 2021-11-08 Price Changed — MRED as Distributed by MLS Grid
- 2021-07-02 Listed — MRED as Distributed by MLS Grid
- 1991-06-21 Sold (Public Records) $310,000 Public Records
- 1984-07-01 Sold (Public Records) $205,000 Public Records
- 1984-03-06 Sold (Public Records) $48,000 Public Records
Property tax history
+0.8%/yrLatest (2023): $14,560 · +3.1% YoY. Source: county tax records.
Cash-flow waterfall
monthlySold comps — $/sqft
last 12 mo · ≤1 miLoading sold comps…