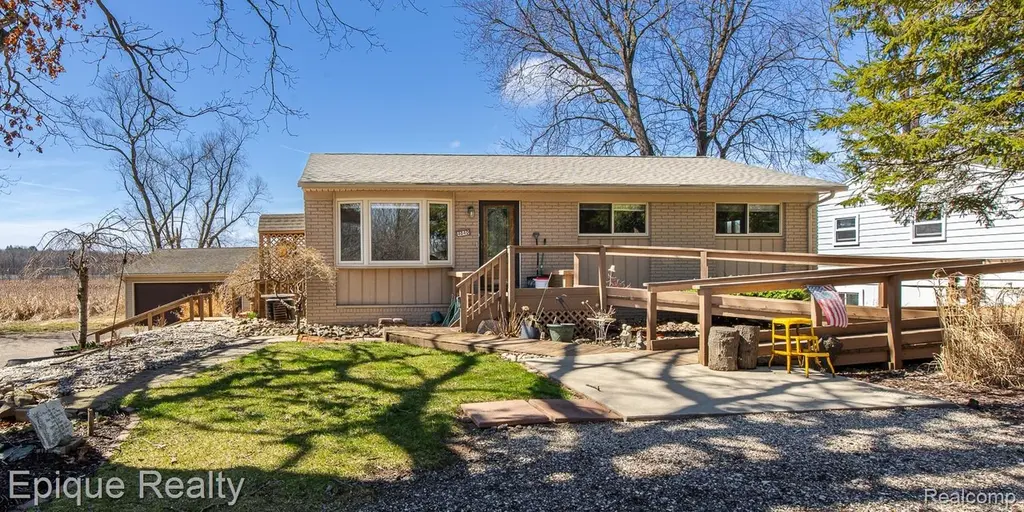
4040 Joslyn Rd
Orion, MI 48359
$285,000D+
3 bd · 1.0 ba ·
1,728 sqft ·
Built 1958
· SingleFamily
· Pending
· 12 DOM
Cashflow @ list (25.0% down · 7.5%)
Estimated rent
$2,428/mo
Mortgage (P&I)
−$1,495
Tax + insurance
−$323
HOA
−$0
Vac / Maint / Mgmt
−$510
Net cashflow
$101/mo
Annual
$1,210/yr
Cap rate
6.72%
Cash-on-cash
1.52%
DSCR
1.07
1% rule
0.85%
Cash to close
$79,800
Investor read
- This is a 3-bed/1.0-bath single-family listed at $285k.
- At list price, monthly cash flow is $101 ($1k/yr) — positive.
- The deal already cash-flows at list — no discount required.
- To meet the 1% rule (rent ≥ 1% of price), the offer needs to be $243k (14.8% below list).
- Only 12 days on market — expect competitive offers; lowballing is unlikely to land.
- Recommended offer: $243k (14.8% below list) — sets the bar for 1% rule.
- Local home prices are declining (-3.0%/yr); year-one equity from $2k of loan paydown is wiped out by about $9k of value loss. Plan a longer hold.
- Location reads: area grade D — affects rentability + tenant quality, not the cash-flow math above.
- Lake Orion Community Schools (suburban): math 49% / reading 64% proficiency, ranked #45 of 540 in MI (top 8%) — acceptable for families but not a draw, mixed tenant base, ~2y average lease; only 16% free/reduced lunch — higher-income household profile.
- Zoned schools: Webber School (math 70% / reading 76%, grade A, #50 of 1,397 statewide, top 4%, 518 students, 20% FRL); Waldon Middle School (math 45% / reading 61%, grade C+, #90 of 493 statewide, top 19%, 547 students, 26% FRL); Lake Orion Community High School (math 54% / reading 75%, grade B-, #46 of 713 statewide, top 7%, 2,174 students, 24% FRL).
- Watch-outs: built in 1958 — expect roof / HVAC / electrical / plumbing capex.
- Market conditions: 58 active listings in the ZIP; 1 comparable units currently listed for rent nearby; solid renter incomes; 2,614 units permitted in Oakland County in 2024 (721 in 5+ unit buildings).
- Oakland County population projected at +10% by 2050 — modest demand growth; plan on rents tracking national, not racing it.
- 2 sale attempts with the ask held roughly flat each time — persistent listings suggest the price (not the market) is what's stuck; bring a comps-based counter.
- Climate carrying-cost: major flood risk — expect insurance premiums to compound above CPI over the hold.
- This rent runs 31% of the median local income ($93k/yr) — at the standard rent-burdened threshold; future hikes will face affordability resistance.
Questions for listing agent
- Built in 1958 — when were the roof, HVAC, electrical panel, plumbing, and water heater last replaced?
- Is there a deadline driving the sale (1031 exchange, divorce, estate, relocation)? That informs how much negotiation room exists.
- The area grade is low — what's the realistic commute time and amenity access for the typical tenant pool here? Any planned neighborhood developments (good or bad) we should know about?
- What's the average days-on-market for RENTAL listings here right now (not sales)? A rising rental-DOM trend means longer vacancies and softer asking-rent achievability than the comps imply.
- What's the recent tenant-quality profile in this submarket — average credit score on applications, eviction rate, late-payment / NSF rate, and stable-employment percentage? A property-management company in the area should have these aggregated.
- How much new for-sale + rental construction is in the pipeline within 1–3 miles? Heavy new supply typically softens prices + rents 12–24 months out; constrained supply supports both.
CashFlowRE · CFR-4J6D4CEYGZWSG9
· Data 4 weeks ago
cashflowre.app · 2026-05-29