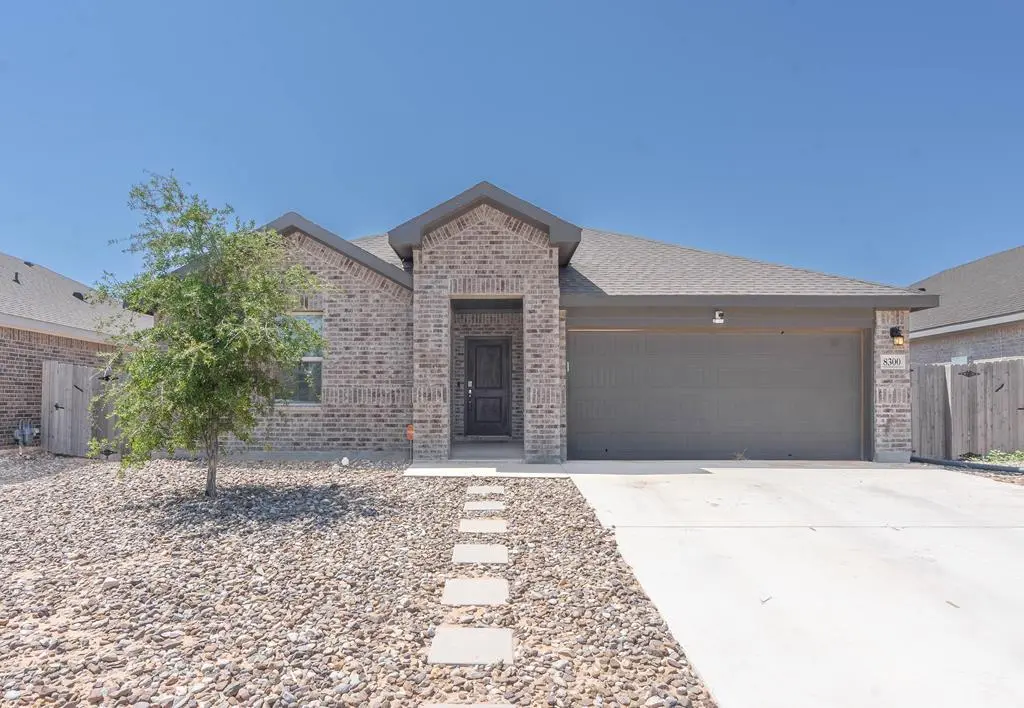
8300 E County Rd 114
Midland, TX 79706
$349,500D-
4 bd · 2.0 ba ·
2,158 sqft ·
Built 2022
· SingleFamily
· Active
· 26 DOM
Cashflow @ list (25.0% down · 7.5%)
Estimated rent
$2,845/mo
Mortgage (P&I)
−$1,833
Tax + insurance
−$526
HOA
−$38
Vac / Maint / Mgmt
−$597
Net cashflow
$-149/mo
Annual
$-1,788/yr
Cap rate
5.78%
Cash-on-cash
-1.83%
DSCR
0.92
1% rule
0.81%
Cash to close
$97,860
Investor read
- This is a 4-bed/2.0-bath single-family listed at $350k. Condition is rated good.
- At list price, monthly cash flow is $-149 ($-2k/yr) — negative.
- To cash-flow at today's rent, offer at most $323k (7.5% below list).
- To meet the 1% rule (rent ≥ 1% of price), the offer needs to be $284k (18.6% below list).
- It's been on market 26 days — a 2% lower offer ($344k) is reasonable based on typical stale-listing flexibility.
- Recommended offer: $284k (18.6% below list) — sets the bar for 1% rule.
- Local home prices are declining (-3.0%/yr); year-one equity from $2k of loan paydown is wiped out by about $10k of value loss. Plan a longer hold.
- Location reads 79/100 on livability (#57 in TX, #2,192 nationally) — a middle-class / working-renter tenant base. Strengths: employment A+, housing A+, health & safety A+; Watch: crime C-, commute D+, amenities D.
- Greenwood ISD (rural): math 45% / reading 44% proficiency, ranked #220 of 826 in TX (top 27%) — families likely to look elsewhere, expect single-tenant / working-renter base with shorter leases.
- Zoned schools: Greenwood El (795 students, 45% FRL); James R Brooks Middle (math 49% / reading 44%, grade D+, #443 of 1,662 statewide, top 28%, 756 students, 37% FRL); Greenwood H S (math 51% / reading 53%, grade D+, #447 of 1,632 statewide, top 29%, 808 students, 33% FRL).
- Market conditions: Rents rising (+2.8%/yr); 383 active listings in the ZIP; 40 comparable units currently listed for rent nearby; rentals at typical pace (median 23d on market — plan ~3-4 weeks tenant-placement turnaround); 45% of comp listings sitting > 30 days — soft ceiling on asking rent; solid renter incomes; 1,504 units permitted in Midland County in 2024 (0 in 5+ unit buildings).
- Midland County population projected at +83% by 2050 — long-run rental-demand tailwind backs the buy-and-hold thesis.
- Cap rate 5.8% vs local median 4.7% in Midland — meaningfully above typical; check what's discounted (condition, days-on-market, listing class) to confirm the premium yield is real.
- This rent runs 32% of the median local income ($108k/yr) — at the standard rent-burdened threshold; future hikes will face affordability resistance.
Questions for listing agent
- What do current leases actually rent for vs. the listed asking? Can we see a recent rent roll and the last 12 months of T-12 income?
- What does the HOA fee cover, when was the last increase, and are there any pending special assessments or reserve-fund shortfalls?
- Is there a deadline driving the sale (1031 exchange, divorce, estate, relocation)? That informs how much negotiation room exists.
- The area grade is low — what's the realistic commute time and amenity access for the typical tenant pool here? Any planned neighborhood developments (good or bad) we should know about?
- What's the average days-on-market for RENTAL listings here right now (not sales)? A rising rental-DOM trend means longer vacancies and softer asking-rent achievability than the comps imply.
- What's the recent tenant-quality profile in this submarket — average credit score on applications, eviction rate, late-payment / NSF rate, and stable-employment percentage? A property-management company in the area should have these aggregated.
- How much new for-sale + rental construction is in the pipeline within 1–3 miles? Heavy new supply typically softens prices + rents 12–24 months out; constrained supply supports both.
CashFlowRE · CFR-4JH1SQAVCRYGJH
· Data 8 h ago
cashflowre.app · 2026-05-29