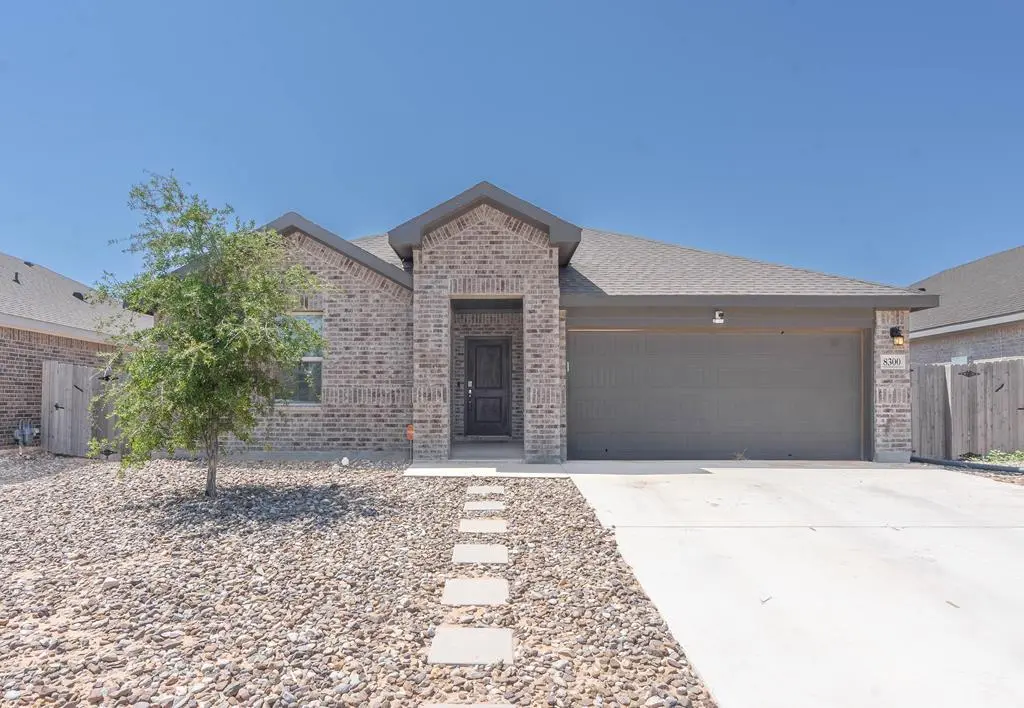
8300 E County Rd 114 · Midland, TX
Flood risk No data
- FEMA flood zone
- —
- Chance of flooding over 30 yrs
- —
- Est. flood insurance / yr
- —
Fire risk No data
- Est. fire insurance / yr
- —
Heat risk No data
- Hot days now (above threshold)
- —
- Hot days in 30 yrs
- —
Wind risk No data
- Chance of severe wind over 30 yrs
- —
Air-quality risk No data
- Unhealthy air days now
- —
- Unhealthy air days in 30 yrs
- —
Risk factors via First Street. Map © Google.
Why this score? — see what drove the D- grade
The composite is a weighted blend of 9 inputs, each scored 0–100. Each bar is that input's sub-score; the figure is the points it added to the 100-point composite (weight × sub-score).
- Cash flow +11.0/30.0
- ARV discount +7.5/15.0
- Schools +4.1/10.0
- Livability +4.0/5.0
- Condition / age +4.0/5.0
- DSCR +3.2/10.0
- Rent growth +3.2/5.0
- 1% rule +3.1/10.0
- Appreciation +0.0/10.0
$349,500
🖨 Deal sheet (PDF) 📄 Offer letter ✓ Due diligence
Listing remarks
Welcome to 8300 E County Rd 114- a 4-bedroom, 2-bathroom home in the highly sought-after Greenwood ISD! Walking distance to the brand new elementary school (scheduled to open in August) and neighborhood pool! Built for easy living, this property features a standout backyard retreat with a raised deck and low-maintenance artificial turf, perfect for entertaining and playing year-round. Inside, enjoy a functional layout with large bedrooms and tons of storage! Spacious and low-maintenance, perfect for your future home! Schedule your showing today!
Key facts
- Raised deck
- Backyard retreat
- Artificial turf
Tags
Property features AI
Finance
- HOA & community: Homeowners association with an annual fee of $450 (about $37.50/month)
Exterior
- Parking: 2-car garage with garage door opener
- Security: Security system; Smoke detectors
- Utilities: Public sewer
- Home design: Single family residence; Single-story
- Construction: Brick veneer construction; Composition roof; Slab foundation; Built on a 0.137-acre lot
- Exterior features: Covered patio; Patio; Deck; Wood fencing
Interior
- Kitchen: Oven; Dishwasher; Disposal; Microwave; Gas range
- Flooring: Carpet; Tile
- Bathrooms: 2 full bathrooms
- Heating & cooling: Central heating (Natural Gas); Central air; Ceiling fans
- Interior features: Pantry; Security system; Smoke detectors
- Laundry & utility: Dryer; Gas water heater
Neighborhood map
What this means for you Summary
Snapshot
- This is a 4-bed/2.0-bath single-family listed at $350k. Condition is rated good.
Deal economics
- At list price, monthly cash flow is $-149 ($-2k/yr) — negative.
- To cash-flow at today's rent, offer at most $323k (7.5% below list).
- To meet the 1% rule (rent ≥ 1% of price), the offer needs to be $284k (18.6% below list).
- Recommended offer: $284k (18.6% below list) — sets the bar for 1% rule.
- Cap rate 5.8% vs local median 4.7% in Midland — meaningfully above typical; check what's discounted (condition, days-on-market, listing class) to confirm the premium yield is real.
Location & tenants
- Location reads 79/100 on livability (#57 in TX, #2,192 nationally) — a middle-class / working-renter tenant base. Strengths: employment A+, housing A+, health & safety A+; Watch: crime C-, commute D+, amenities D.
- Greenwood ISD (rural): math 45% / reading 44% proficiency, ranked #220 of 826 in TX (top 27%) — families likely to look elsewhere, expect single-tenant / working-renter base with shorter leases.
- Zoned schools: Greenwood El (795 students, 45% FRL); James R Brooks Middle (math 49% / reading 44%, grade D+, #443 of 1,662 statewide, top 28%, 756 students, 37% FRL); Greenwood H S (math 51% / reading 53%, grade D+, #447 of 1,632 statewide, top 29%, 808 students, 33% FRL).
- Market conditions: Rents rising (+2.8%/yr); 383 active listings in the ZIP; 40 comparable units currently listed for rent nearby; rentals at typical pace (median 23d on market — plan ~3-4 weeks tenant-placement turnaround); 45% of comp listings sitting > 30 days — soft ceiling on asking rent; solid renter incomes; 1,504 units permitted in Midland County in 2024 (0 in 5+ unit buildings).
- This rent runs 32% of the median local income ($108k/yr) — at the standard rent-burdened threshold; future hikes will face affordability resistance.
Forward outlook
- Local home prices are declining (-3.0%/yr); year-one equity from $2k of loan paydown is wiped out by about $10k of value loss. Plan a longer hold.
- Midland County population projected at +83% by 2050 — long-run rental-demand tailwind backs the buy-and-hold thesis.
Negotiation context
- It's been on market 26 days — a 2% lower offer ($344k) is reasonable based on typical stale-listing flexibility.
Questions for the listing agent
- What do current leases actually rent for vs. the listed asking? Can we see a recent rent roll and the last 12 months of T-12 income?
- What does the HOA fee cover, when was the last increase, and are there any pending special assessments or reserve-fund shortfalls?
- Is there a deadline driving the sale (1031 exchange, divorce, estate, relocation)? That informs how much negotiation room exists.
- The area grade is low — what's the realistic commute time and amenity access for the typical tenant pool here? Any planned neighborhood developments (good or bad) we should know about?
- What's the average days-on-market for RENTAL listings here right now (not sales)? A rising rental-DOM trend means longer vacancies and softer asking-rent achievability than the comps imply.
- What's the recent tenant-quality profile in this submarket — average credit score on applications, eviction rate, late-payment / NSF rate, and stable-employment percentage? A property-management company in the area should have these aggregated.
- How much new for-sale + rental construction is in the pipeline within 1–3 miles? Heavy new supply typically softens prices + rents 12–24 months out; constrained supply supports both.
Investment metrics
- 1% rule
- 0.81% ✗
- Cap rate
- 5.78%
- Cash-on-cash
- -1.83%
- DSCR
- 0.92
- GRM
- 10.2
CMA / ARV
No comps found within radius.
Projected returns pro-forma
-3.0% appreciation · 2.75% rent growth · sell at horizon
- IRR
- -19.6%
- Equity multiple
- 0.32×
- Total profit
- $-66,809
- Equity at exit
- $52,112
- IRR
- -12.9%
- Equity multiple
- 0.25×
- Total profit
- $-73,186
- Equity at exit
- $30,218
Cash invested: $97,860 (down + closing). Projections, not guarantees.
Landlord ↔ Tenant lean methodology
- Overall (STATE)
- 87 Strongly Landlord-Friendly
- State Texas
- 87 Strongly Landlord-Friendly · R+5
- County
- — inherits STATE
- City
- — inherits STATE
ZIP-level market 79706
- Rents YoY
- 2.8%
- Active inventory
- 383
- Price-to-rent
- 10.2×
Monthly cashflow live
- Estimated rent
- $2,845 high interval (Pro) →
- Mortgage (P&I)
- −$1,833
- Tax from tax record
- −$380 /mo · $4,561/yr
- Insurance
- −$146
- HOA
- −$38
- Vacancy / Maint / Mgmt
- −$597
- Net cashflow
- $-149
Break-even live
Sensitivity live
| Price | -10% $49 | -5% $-50 | +0% $-149 | +5% $-248 | +10% $-347 |
|---|---|---|---|---|---|
| Rent | -10% $-374 | -5% $-261 | +0% $-149 | +5% $-37 | +10% $76 |
| Rate | -1.0pp $27 | -0.5pp $-60 | base $-149 | +0.5pp $-240 | +1.0pp $-332 |
UW: 25.0% down · 7.5% · 30yr · 1.5% tax · 5.0% vac · 8.0% maint · 8.0% mgmt
Financing live
Cash to close
- Down payment
- $87,375
- Closing costs
- $10,485
- Reserves months
- —
- Total cash needed
- —
Loan-product check · same deal, 3 products live
Conventional
25% down · 7.5% · 30yr
- Down + closing
- —
- Monthly P&I
- —
- Monthly cashflow
- —
- DSCR
- —
- Eligible?
- —
Personal DTI + credit; lowest rate.
DSCR
20% down · 8.5% · 30yr
- Down + closing
- —
- Monthly P&I
- —
- Monthly cashflow
- —
- DSCR
- —
- Eligible?
- —
No personal income docs; deal must DSCR.
Hard money
10% down · 12.0% · 12mo
- Down + closing
- —
- Monthly P&I
- —
- Monthly cashflow
- —
- DSCR
- —
- Eligible?
- —
Short-term bridge; refi at stabilization.
Rent comps 40 comps
| Address | Beds | Baths | Sqft | Rent | $/sqft | DOM | Units | Dist |
|---|---|---|---|---|---|---|---|---|
| 8313 E County Road 115 Midland, TX | 3.0 | 2.0 | 1616 | $2,250 | $1.39 | 22d | 1 | 0.05mi |
| 8205 E County Road 115 Midland, TX | 4.0 | 3.0 | 1782 | $2,904 | $1.63 | 15d | 1 | 0.08mi |
| 8205 E County Road 115 Midland, TX | 4.0 | 3.0 | 1782 | $3,485 | $1.96 | 45d | 1 | 0.08mi |
| 8309 E County Road 113 Midland, TX | 3.0 | 2.0 | 1653 | $2,558 | $1.55 | 22d | 1 | 0.09mi |
| 8126 E County Road 114 Midland, TX | 3.0 | 2.0 | 1500 | $2,850 | $1.90 | 15d | 1 | 0.13mi |
| 8128 E County Road 115 Midland, TX | 3.0 | 2.0 | 1616 | $2,250 | $1.39 | 15d | 1 | 0.23mi |
| 8326 E County Road 115 Midland, TX | 4.0 | 3.0 | 1782 | $2,904 | $1.63 | 15d | 1 | 0.23mi |
| 8130 E County Road 115 Midland, TX | 3.0 | 2.0 | 1616 | $3,070 | $1.90 | 45d | 1 | 0.23mi |
| 8330 E County Road 115 Midland, TX | 3.0 | 2.0 | 1616 | $3,070 | $1.90 | 45d | 1 | 0.23mi |
| 8304 E County Road 115 Midland, TX | 3.0 | 2.0 | 1616 | $2,250 | $1.39 | 22d | 1 | 0.23mi |
| 8330 E County Road 115 Midland, TX | 3.0 | 2.0 | 1616 | $2,250 | $1.39 | 22d | 1 | 0.23mi |
| 8130 E County Road 115 Midland, TX | 3.0 | 2.0 | 1616 | $2,658 | $1.64 | 22d | 1 | 0.23mi |
| 8326 E County Road 115 Midland, TX | 4.0 | 3.0 | 1782 | $3,485 | $1.96 | 45d | 1 | 0.23mi |
| 8220 E County Road 115 Midland, TX | 3.0 | 2.0 | 1616 | $2,250 | $1.39 | 22d | 1 | 0.23mi |
| 3100 S County Road 1109 Midland, TX | 3.0 | 2.0 | 1616 | $2,250 | $1.39 | 22d | 1 | 0.24mi |
| 8031 E County Road 114 Midland, TX | 3.0 | 2.0 | 1500 | $2,850 | $1.90 | 15d | 1 | 0.24mi |
| 3108 S County Road 1109 Midland, TX | 3.0 | 2.0 | 1616 | $2,658 | $1.64 | 45d | 1 | 0.26mi |
| 3123 S County Road 1109 Midland, TX | 4.0 | 3.0 | 1782 | $2,904 | $1.63 | 15d | 1 | 0.28mi |
| 3123 S County Road 1109 Unit 1109 Midland, TX | 4.0 | 3.0 | 1782 | $3,485 | $1.96 | 45d | 1 | 0.28mi |
| 2516 S County Rd 1103 Midland, TX | 3.0 | 2.0 | 1616 | $2,250 | $1.39 | 22d | 1 | 0.29mi |
| 2512 S County Road 1103 Midland, TX | 3.0 | 2.0 | 1633 | $2,699 | $1.65 | 45d | 1 | 0.30mi |
| 8319 Ecr Midland, TX | 3.0 | 2.0 | 1558 | $2,960 | $1.90 | 15d | 1 | 0.33mi |
| 8101 E County Road 114 Midland, TX | 3.0 | 2.0 | 1500 | $2,250 | $1.50 | 15d | 1 | 0.50mi |
| 8307 E County Road 115 Midland, TX | 3.0 | 2.0 | 1616 | $2,250 | $1.39 | 22d | 1 | 0.50mi |
| 8502 E County Road 111 Midland, TX | 3.0 | 2.0 | 1616 | $3,070 | $1.90 | 45d | 1 | 0.86mi |
| 8506 E County Road 111 Midland, TX | 4.0 | 3.0 | 1782 | $3,485 | $1.96 | 45d | 1 | 0.86mi |
| 8512 E County Road 111 Midland, TX | 3.0 | 2.0 | 1616 | $3,070 | $1.90 | 45d | 1 | 0.86mi |
| 8506 E County Road 111 Midland, TX | 4.0 | 3.0 | 1782 | $2,904 | $1.63 | 22d | 1 | 0.86mi |
| 8507 E County Road 111 Midland, TX | 3.0 | 2.0 | 1500 | $2,850 | $1.90 | 45d | 1 | 0.86mi |
| 8504 E County Road 111 Midland, TX | 3.0 | 2.0 | 1500 | $2,850 | $1.90 | 45d | 1 | 0.86mi |
| 8500 E County Road 111 Midland, TX | 3.0 | 2.0 | 1500 | $2,850 | $1.90 | 45d | 1 | 0.86mi |
| 8512 E County Road 111 Midland, TX | 3.0 | 2.0 | 1616 | $2,250 | $1.39 | 22d | 1 | 0.86mi |
| 8128 E County Road 111 Midland, TX | 3.0 | 2.0 | 1616 | $2,250 | $1.39 | 22d | 1 | 0.86mi |
| 8510 E County Road 111 Midland, TX | 4.0 | 3.0 | 1782 | $3,485 | $1.96 | 45d | 1 | 0.86mi |
| 8508 E County Road 111 Midland, TX | 3.0 | 2.0 | 1500 | $2,850 | $1.90 | 45d | 1 | 0.86mi |
| 2521 S Co Road 1105 Midland, TX | 3.0 | 2.0 | 1616 | $2,250 | $1.39 | 22d | 1 | 1.01mi |
| 2521 S Co Road 1105 Unit 1105 Midland, TX | 3.0 | 2.0 | 1616 | $3,070 | $1.90 | 45d | 1 | 1.01mi |
| 2505 S Co Road 1101 Unit 1101 Midland, TX | 4.0 | 3.0 | 1500 | $3,485 | $2.32 | 45d | 1 | 1.16mi |
| 2509 S Co Road 1101 Unit 1101 Midland, TX | 3.0 | 2.0 | 1616 | $3,070 | $1.90 | 45d | 1 | 1.16mi |
| 2513 S Co Road 1101 Midland, TX | 3.0 | 2.0 | 1500 | $2,250 | $1.50 | 15d | 1 | 1.16mi |
HOA detail
- Monthly dues
- $38 · $456/yr
- Likely covers
- pool
Listing history 28 events
-
2026-06-22days on market $349,500 Active 26 DOM
-
2026-06-19days on market $349,500 Active 24 DOM
-
2026-06-18days on market $349,500 Active 23 DOM
-
2026-06-17days on market $349,500 Active 22 DOM
-
2026-06-16days on market $349,500 Active 21 DOM
-
2026-06-15days on market $349,500 Active 20 DOM
-
2026-06-14days on market $349,500 Active 18 DOM
-
2026-06-13days on market $349,500 Active 17 DOM
-
2026-06-10days on market $349,500 Active 15 DOM
-
2026-06-09days on market $349,500 Active 14 DOM
-
2026-06-08days on market $349,500 Active 13 DOM
-
2026-06-07days on market $349,500 Active 12 DOM
-
2026-06-02days on market $349,500 Active 7 DOM
-
2026-06-01days on market $349,500 Active 6 DOM
-
2026-05-31days on market $349,500 Active 5 DOM
-
2026-05-30days on market $349,500 Active 4 DOM
-
2026-05-26$349,500 Active
-
2025-10-18price $355,000
-
2025-10-18price $355,000
-
2025-09-20price $358,000
-
2025-09-20price $358,000
-
2025-08-27price $372,900
-
2025-08-12price $375,000
-
2025-06-18price $358,500
-
2025-06-04price $368,500
-
2025-05-30price $372,000
-
2025-04-21price $374,000
-
2025-03-27price $377,500
ⓘ Source: listings_history table (triggers on properties + properties_extension) + one-shot
backfill from property_details.listing_events for pre-trigger history.
Tax reassessment forecast TX · Resets to sale price
- Current annual tax
- $4,561 · $380/mo
- Projected year-2 tax
- $6,396 · $533/mo
- Expected delta
- +$1,835/yr (+$153/mo · 40.2%)
ⓘ Screening estimate from a state-policy table — verify with the county assessor before closing.
Nearby sold comps map
Loading sold comps map…
Walkable amenities ~0.75 mi
Loading nearby amenities…
Taxation est. · year 1
- Rental income
- $34,139
- − Mortgage interest
- −$19,577
- − Property taxes
- −$4,561
- − Insurance
- −$1,748
- − Repairs & maintenance
- −$2,731
- − Management
- −$2,731
- − HOA
- −$456
- − Depreciation
- −$10,167
- Taxable loss
- −$7,832
- Est. tax savings @ 24.0%
- +$1,880
- After-tax cash flow
- $91/yr
For passive investors: Depreciation is non-cash, so a rental often shows a tax loss while cash-flowing — sheltering income. Rental losses are passive: they offset passive income freely, and up to $25,000/yr can offset ordinary (W-2) income if you actively participate and your MAGI is under $100k (phasing out to $0 by $150k); unused losses carry forward. On sale, claimed depreciation is recaptured at up to 25%, and gains may owe capital-gains tax (a 1031 exchange can defer both). Figures are a year-1 estimate at your 24.0% rate — not tax advice; consult a CPA.
Condition & rehab AI · 6 photos
This home is in good condition with a modern kitchen and bathrooms, and a well-maintained exterior. It has potential for further updates to enhance its curb appeal and value.
Value-add opportunities
- Both Painting the exterior brick and updating the landscaping — Enhances curb appeal and adds value for both resale and rental.
- Resale Upgrading the flooring in the bathrooms — Modernizes the bathrooms and improves aesthetics.
- Both Installing smart home features — Improves convenience and adds value for both resale and rental.
Renovation cost estimate screening
Value-add ROI direction
- Both Painting the exterior brick and updating the landscaping — Enhances curb appeal and adds value for both resale and rental. ↑
- Resale Upgrading the flooring in the bathrooms — Modernizes the bathrooms and improves aesthetics. ↑
- Both Installing smart home features — Improves convenience and adds value for both resale and rental. ↑
ⓘ Cost ranges are severity-bucket heuristics (US national rule-of-thumb). Get contractor quotes + a written scope before underwriting a rehab budget.
Schools (NCES district)
- District
- Greenwood ISD
- NCES district ID
- 4821750
- Math proficiency
- 45% ▲ 4.00%
- Reading proficiency
- 44% ▲ 1.00%
- Median HH income
- $74,012
- Composite
- 40.54/100
- National rank
- #3701
- State rank
- #220 of 826 in TX
Livability — Midland
- Score
- 79/100
- State rank
- #57
- US rank
- #2192
Category grades
Schools grade is shown separately in the Schools card above.
Census & demographics
- County
- Midland County · 168,494 people
- City population
- 168,494
- Metro
- Midland, TX
- Population (ZIP)
- 34,281
- Household income
- $108,059
- Rent vs Own
- Severe rent burden
- 303.0
Population outlook (Midland County) Hauer SSP2
- Today (2025)
- 220,895 people
- By 2030
- 253,667 · +14.8%
- By 2040
- 325,498 · +47.4%
- By 2050
- 404,168 · +83.0%
- By 2075
- 609,802 · +176.1%
- By 2100
- 760,172 · +244.1%
Race, ethnicity, and origin ACS 2023
- Neighborhood character
- Diverse neighborhood (Simpson 0.58)
- Race & ethnicity
- Hispanic / Latino 48% White 44% Two or more races 13% Black 3% Asian 2%
- Hispanic origin (detail)
- Mexican 43% Cuban 1%
- Common ancestry
- Italian 1% Lithuanian 1% Swedish 1%
- Foreign-born
- 11% · Canada
- Languages at home
- 68% English-only · Spanish 30%
Political lean MEDSL · Midland
- 2024 margin
- Solid R (+60.5) · D 19.3% · R 79.8%
- 2008→2024 swing
- -3.3pp toward R · 2008: -57.3pp · 2024: -60.5pp
- All cycles
- 2024: R+60.5 2020: R+56.6 2016: R+55.2 2012: R+61.5 2008: R+57.3
Not yet ingested
- Civics
- —
Market trends
- HPI YoY
- ▼ -173.42%
- Current HPI
- 212.6467
- Rent YoY
- ▲ 2.75%
- Metro
- Midland, TX
- State GDP YoY
- ▲ 3.95%
- F500 in state
- 110
Industry mix (Fortune 500 HQ in TX)
| Industry | F500 HQs | Revenue |
|---|---|---|
| Energy | 16 | $1,198B |
|
||
| Technology | 5 | $198B |
|
||
| Engineering / Construction | 4 | $72B |
|
||
| Energy Services | 3 | $60B |
|
||
| Utilities | 3 | $41B |
|
||
| Healthcare | 2 | $330B |
|
||
Price history
-7.4% since first listed12 events — show timeline
- 2026-05-26 Listed $349,500 PBBOR
- 2025-10-18 Price Changed $355,000 ODMLS
- 2025-10-18 Price Changed $355,000 PBBOR
- 2025-09-20 Price Changed $358,000 ODMLS
- 2025-09-20 Price Changed $358,000 PBBOR
- 2025-08-27 Price Changed $372,900 PBBOR
- 2025-08-12 Price Changed $375,000 PBBOR
- 2025-06-18 Price Changed $358,500 PBBOR
- 2025-06-04 Price Changed $368,500 PBBOR
- 2025-05-30 Price Changed $372,000 PBBOR
- 2025-04-21 Price Changed $374,000 PBBOR
- 2025-03-27 Price Changed $377,500 PBBOR
Property tax history
+93.5%/yrLatest (2025): $4,561 · -1.9% YoY. Source: county tax records.
Cash-flow waterfall
monthlySold comps — $/sqft
last 12 mo · ≤1 miLoading sold comps…