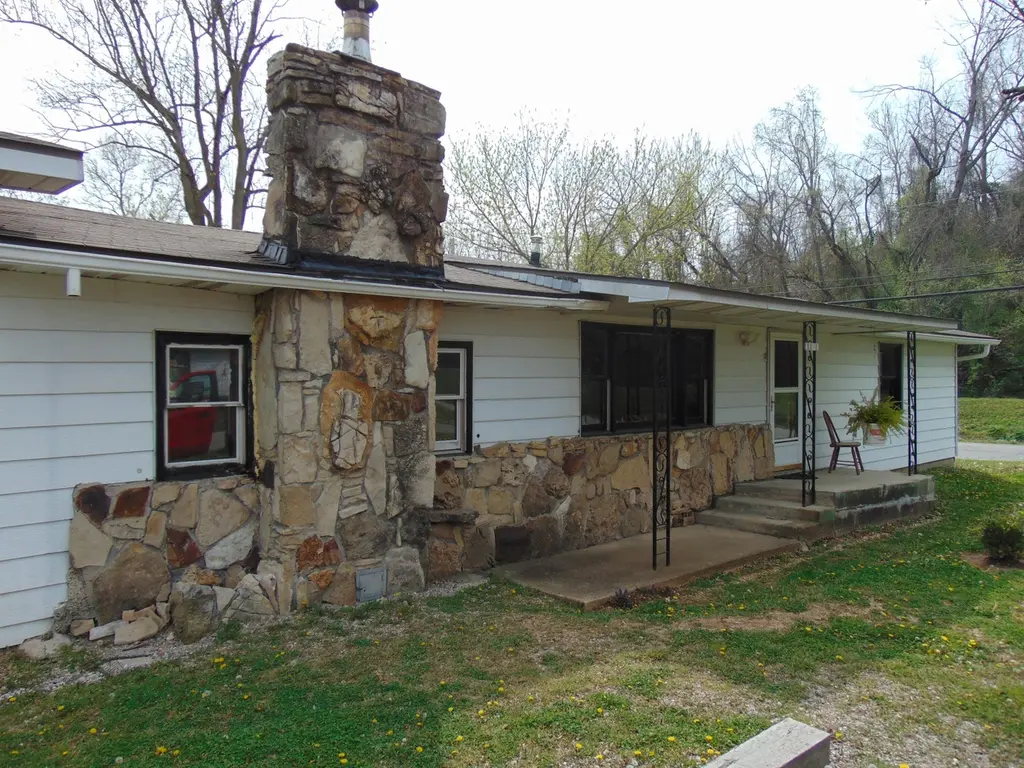
1101 Sapp St
Cassville, MO 65625
$89,900B
2 bd · 2.0 ba ·
1,326 sqft ·
Built 1964
· SingleFamily
· Active
· 56 DOM
Cashflow @ list (25.0% down · 7.5%)
Estimated rent
$1,138/mo
Mortgage (P&I)
−$471
Tax + insurance
−$502
HOA
−$0
Vac / Maint / Mgmt
−$239
Net cashflow
$-75/mo
Annual
$-896/yr
Cap rate
10.99%
Cash-on-cash
16.77%
DSCR
1.75
1% rule
1.27%
Cash to close
$25,172
Investor read
- This is a 2-bed/2.0-bath single-family listed at $90k.
- At list price, monthly cash flow is $-75 ($-896/yr) — negative.
- To cash-flow at today's rent, offer at most $77k (14.7% below list).
- Meets the 1% rule at list price ($1k rent vs $90k).
- It's been on market 56 days — a 3% lower offer ($87k) is reasonable based on typical stale-listing flexibility.
- Recommended offer: $77k (14.7% below list) — sets the bar for cash-flow.
- Local home prices are declining (-3.0%/yr); year-one equity from $622 of loan paydown is wiped out by about $3k of value loss. Plan a longer hold.
- Location reads 66/100 on livability (#243 in MO) — a middle-class / working-renter tenant base. Strengths: cost of living A+, housing A-, crime B; Watch: schools C-, health & safety C-, amenities F.
- Cassville R-IV (town): math 33% / reading 47% proficiency, ranked #157 of 324 in MO (top 48%) — families likely to look elsewhere, expect single-tenant / working-renter base with shorter leases.
- Watch-outs: flood insurance adds $427/mo.
- Market conditions: 90 active listings in the ZIP; 57 units permitted in Barry County in 2024 (0 in 5+ unit buildings).
- Barry County population projected at -13% by 2050 — secular population decline; favor cash flow + early exit over multi-decade hold.
- 2 sale attempts since 4y ago with the ask held roughly flat each time — persistent listings suggest the price (not the market) is what's stuck; bring a comps-based counter.
- Climate carrying-cost: in FEMA flood zone AE (mandatory federal flood insurance); moderate wildfire risk — expect insurance premiums to compound above CPI over the hold.
- Cap rate 11.0% vs local median 2.6% in Cassville — top-decile yield for the area; either an underpriced asset or a hidden risk that comps aren't pricing in. Stress-test before assuming the spread holds.
Questions for listing agent
- What do current leases actually rent for vs. the listed asking? Can we see a recent rent roll and the last 12 months of T-12 income?
- It's been on market 56 days. Have you received any prior offers? Is the seller open to a 15% concession, seller financing, or rate buy-down credit?
- Built in 1964 — when were the roof, HVAC, electrical panel, plumbing, and water heater last replaced?
- What's the actual annual flood-insurance premium (NFIP or private), and is the property in a SFHA with mandatory coverage?
- Is there a deadline driving the sale (1031 exchange, divorce, estate, relocation)? That informs how much negotiation room exists.
- What's the average days-on-market for RENTAL listings here right now (not sales)? A rising rental-DOM trend means longer vacancies and softer asking-rent achievability than the comps imply.
- What's the recent tenant-quality profile in this submarket — average credit score on applications, eviction rate, late-payment / NSF rate, and stable-employment percentage? A property-management company in the area should have these aggregated.
- How much new for-sale + rental construction is in the pipeline within 1–3 miles? Heavy new supply typically softens prices + rents 12–24 months out; constrained supply supports both.
CashFlowRE · CFR-4K8F221Z2RWT5S
· Data 3 weeks ago
cashflowre.app · 2026-05-29