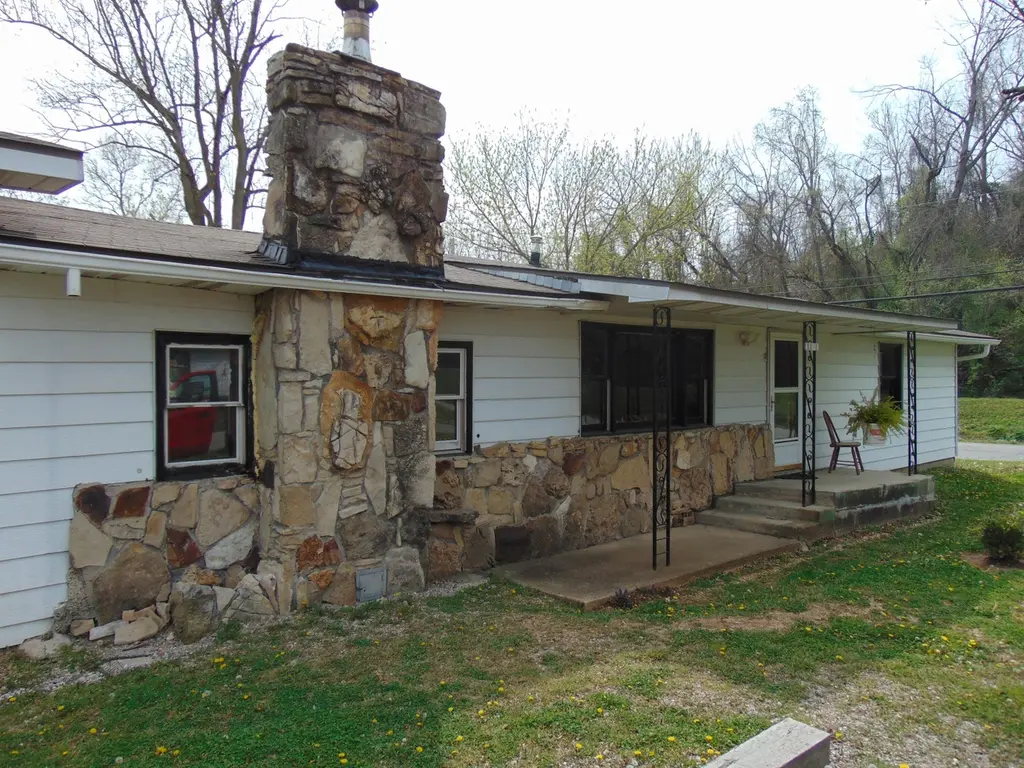
1101 Sapp St · Cassville, MO
Flood risk 8/10 · Major
- FEMA flood zone
- AE
- Chance of flooding over 30 yrs
- 0.99%
- Est. flood insurance / yr
- $1,737 – $8,500
Fire risk 5/10 · Moderate
- Est. fire insurance / yr
- $1,054 – $1,958
Heat risk 4/10 · Minor
- Hot days now (above 104°F)
- 7 days/yr
- Hot days in 30 yrs
- 20 days/yr
Wind risk 2/10 · Minimal
- Chance of severe wind over 30 yrs
- 1.0%
Air-quality risk 2/10 · Minimal
- Unhealthy air days now
- 1 days/yr
- Unhealthy air days in 30 yrs
- 1 days/yr
Risk factors via First Street. Map © Google.
Why this score? — see what drove the B grade
The composite is a weighted blend of 9 inputs, each scored 0–100. Each bar is that input's sub-score; the figure is the points it added to the 100-point composite (weight × sub-score).
- Cash flow +30.0/30.0
- ARV discount +15.0/15.0
- DSCR +10.0/10.0
- 1% rule +7.7/10.0
- Schools +3.3/10.0
- Livability +3.3/5.0
- Rent growth +2.5/5.0
- Condition / age +2.5/5.0
- Appreciation +0.0/10.0
$89,900
🖨 Deal sheet 📄 Offer letter ✓ Due diligence
Listing remarks MLS
Great starter home, fixer upper, or investment home. On nice sized flat lot, this 3 bedroom 1 bath home is located close to Schools and Services in the city limits of Cassville. Home offers wood floors in 4 rooms, lots of windows, with a two door two car garage. Home also has a 3/4 bathroom that could be refurbished to add convenience. The kitchen and dining are all in one area, with a food bar, original cabinets and possibilities.
Key facts
- Food bar
- Wood floors
- Flat lot
Tags
Neighborhood map
What this means for you Summary
Snapshot
- This is a 2-bed/2.0-bath single-family listed at $90k.
Deal economics
- At list price, monthly cash flow is $-75 ($-896/yr) — negative.
- To cash-flow at today's rent, offer at most $77k (14.7% below list).
- Meets the 1% rule at list price ($1k rent vs $90k).
- Recommended offer: $77k (14.7% below list) — sets the bar for cash-flow.
- Cap rate 11.0% vs local median 2.6% in Cassville — top-decile yield for the area; either an underpriced asset or a hidden risk that comps aren't pricing in. Stress-test before assuming the spread holds.
Location & tenants
- Location reads 66/100 on livability (#243 in MO) — a middle-class / working-renter tenant base. Strengths: cost of living A+, housing A-, crime B; Watch: schools C-, health & safety C-, amenities F.
- Cassville R-IV (town): math 33% / reading 47% proficiency, ranked #157 of 324 in MO (top 48%) — families likely to look elsewhere, expect single-tenant / working-renter base with shorter leases.
- Market conditions: 90 active listings in the ZIP; 57 units permitted in Barry County in 2024 (0 in 5+ unit buildings).
Forward outlook
- Local home prices are declining (-3.0%/yr); year-one equity from $622 of loan paydown is wiped out by about $3k of value loss. Plan a longer hold.
- Barry County population projected at -13% by 2050 — secular population decline; favor cash flow + early exit over multi-decade hold.
Negotiation context
- It's been on market 56 days — a 3% lower offer ($87k) is reasonable based on typical stale-listing flexibility.
- 2 sale attempts since 4y ago with the ask held roughly flat each time — persistent listings suggest the price (not the market) is what's stuck; bring a comps-based counter.
Risks & watch-outs
- Watch-outs: flood insurance adds $427/mo.
- Climate carrying-cost: in FEMA flood zone AE (mandatory federal flood insurance); moderate wildfire risk — expect insurance premiums to compound above CPI over the hold.
Questions for the listing agent
- What do current leases actually rent for vs. the listed asking? Can we see a recent rent roll and the last 12 months of T-12 income?
- It's been on market 56 days. Have you received any prior offers? Is the seller open to a 15% concession, seller financing, or rate buy-down credit?
- Built in 1964 — when were the roof, HVAC, electrical panel, plumbing, and water heater last replaced?
- What's the actual annual flood-insurance premium (NFIP or private), and is the property in a SFHA with mandatory coverage?
- Is there a deadline driving the sale (1031 exchange, divorce, estate, relocation)? That informs how much negotiation room exists.
- What's the average days-on-market for RENTAL listings here right now (not sales)? A rising rental-DOM trend means longer vacancies and softer asking-rent achievability than the comps imply.
- What's the recent tenant-quality profile in this submarket — average credit score on applications, eviction rate, late-payment / NSF rate, and stable-employment percentage? A property-management company in the area should have these aggregated.
- How much new for-sale + rental construction is in the pipeline within 1–3 miles? Heavy new supply typically softens prices + rents 12–24 months out; constrained supply supports both.
Investment metrics
- 1% rule
- 1.27% ✓
- Cap rate
- 10.99%
- Cash-on-cash
- 16.77%
- DSCR
- 1.75
- GRM
- 6.6
CMA / ARV
- ARV (median comp)
- $121,258
- List price
- $89,900
- Delta
- -25.86%
- Verdict
- UNDERPRICED
- Comps
- 20 within 1.0 mi
Show comp detail 12 sales within ~0.75 mi
| Address | Dist | Beds/Ba | Sqft | Sold | Price | $/sf | Match |
|---|---|---|---|---|---|---|---|
| 146 Sunset Hts | 0.37mi | 3/2.0 (+1) | 1,346 (+2%) | 15mo | $160,000 | $119 | 63 |
| 601 7th St | 0.16mi | 3/2.0 (+1) | 1,416 (+7%) | 17mo | $139,000 | $98 | 62 |
| 110 Sunset Heights Rd | 0.33mi | 3/2.0 (+1) | 1,246 (-6%) | 13mo | $164,000 | $132 | 59 |
| 1002 Lake Road Dr | 0.48mi | 3/2.0 (+1) | 1,246 (-6%) | 6mo | $234,000 | $188 | 58 |
| 1114 Ivey St | 0.07mi | 3/1.0 (+1) | 1,152 (-13%) | 15mo | $65,000 | $56 | 53 |
| 300 Crystal View Dr | 0.59mi | 3/2.0 (+1) | 1,446 (+9%) | 1mo | $149,500 | $103 | 52 |
| 304 W 15th St | 0.30mi | 3/1.5 (+1) | 1,143 (-14%) | 8mo | $85,000 | $74 | 49 |
| 1620 Presley Dr | 0.44mi | 2/1.5 | 1,160 (-12%) | 11mo | $152,500 | $131 | 48 |
| 101 N Spring St | 0.63mi | 2/1.5 | 1,204 (-9%) | 13mo | $165,000 | $137 | 42 |
| 34 Sunset St | 0.75mi | 3/2.0 (+1) | 1,442 (+9%) | 5mo | $192,000 | $133 | 42 |
| 2008 Main St | 0.70mi | 2/1.0 | 1,176 (-11%) | 9mo | $150,000 | $128 | 37 |
| 110 Rainbow Dr | 0.57mi | 3/2.0 (+1) | 1,172 (-12%) | 17mo | $225,000 | $192 | 34 |
Match score weights: distance 35% · size 25% · config 20% · recency 20%. Top-matched comps best support the ARV.
Projected returns pro-forma
-3.0% appreciation · 3.0% rent growth · sell at horizon
- IRR
- -21.9%
- Equity multiple
- 0.24×
- Total profit
- $-19,090
- Equity at exit
- $13,404
- IRR
- -15.0%
- Equity multiple
- 0.13×
- Total profit
- $-21,799
- Equity at exit
- $7,773
Cash invested: $25,172 (down + closing). Projections, not guarantees.
Landlord ↔ Tenant lean methodology
- Overall (STATE)
- 81 Strongly Landlord-Friendly
- State Missouri
- 81 Strongly Landlord-Friendly · R+10
- County
- — inherits STATE
- City
- — inherits STATE
ZIP-level market 65625
- Home prices YoY
- -6.8%
- Active inventory
- 90
- Price-to-rent
- 6.6×
Monthly cashflow live
- Estimated rent
- $1,138 medium interval (Pro) →
- Mortgage (P&I)
- −$471
- Tax from tax record
- −$38 /mo · $456/yr
- Insurance
- −$37
- Flood insurance flood zone
- −$427 /mo · $5,118/yr
- HOA
- −$0
- Vacancy / Maint / Mgmt
- −$239
- Net cashflow
- $-75
Break-even live
UW: 25.0% down · 7.5% · 30yr · 1.5% tax · 5.0% vac · 8.0% maint · 8.0% mgmt
Financing live
Cash to close
- Down payment
- $22,475
- Closing costs
- $2,697
- Reserves months
- —
- Total cash needed
- —
Loan-product check · same deal, 3 products live
Conventional
25% down · 7.5% · 30yr
- Down + closing
- —
- Monthly P&I
- —
- Monthly cashflow
- —
- DSCR
- —
- Eligible?
- —
Personal DTI + credit; lowest rate.
DSCR
20% down · 8.5% · 30yr
- Down + closing
- —
- Monthly P&I
- —
- Monthly cashflow
- —
- DSCR
- —
- Eligible?
- —
No personal income docs; deal must DSCR.
Hard money
10% down · 12.0% · 12mo
- Down + closing
- —
- Monthly P&I
- —
- Monthly cashflow
- —
- DSCR
- —
- Eligible?
- —
Short-term bridge; refi at stabilization.
Listing history 3 events
-
2026-03-31$89,900 Active 435-char remark
Show marketing remark (435 chars)
Great starter home, fixer upper, or investment home. On nice sized flat lot, this 3 bedroom 1 bath home is located close to Schools and Services in the city limits of Cassville. Home offers wood floors in 4 rooms, lots of windows, with a two door two car garage. Home also has a 3/4 bathroom that could be refurbished to add convenience. The kitchen and dining are all in one area, with a food bar, original cabinets and possibilities.
-
2022-05-13soldstatus 158-char remark
Show marketing remark (158 chars)
This house is perfect for a flipper or investor. Two bedrooms, two baths. Level corner lot on a dead-end street. Needs work, but could be a cute little house.
-
2022-04-27$79,900 158-char remark
Show marketing remark (158 chars)
This house is perfect for a flipper or investor. Two bedrooms, two baths. Level corner lot on a dead-end street. Needs work, but could be a cute little house.
ⓘ Source: listings_history table (triggers on properties + properties_extension) + one-shot
backfill from property_details.listing_events for pre-trigger history.
Tax reassessment forecast MO · Resets to sale price
- Current annual tax
- $456 · $38/mo
- Projected year-2 tax
- $872 · $73/mo
- Expected delta
- +$416/yr (+$35/mo · 91.0%)
ⓘ Screening estimate from a state-policy table — verify with the county assessor before closing.
Climate risk First Street
- Flood 8/10 Severe FEMA zone AE · 99% chance over 30 yrs
- Wildfire 5/10 Major
- Heat 4/10 Moderate 7 d/yr ≥104°F today · 20 d/yr by 30 yrs out
- Wind 2/10 Low 100% chance of damaging wind over 30 yrs
- Air quality 2/10 Low 1 unhealthy d/yr today · 1 by 30 yrs out
Nearby sold comps map
Loading sold comps map…
Walkable amenities ~0.75 mi
Loading nearby amenities…
Taxation est. · year 1
- Rental income
- $13,653
- − Mortgage interest
- −$5,036
- − Property taxes
- −$456
- − Insurance
- −$5,568
- − Repairs & maintenance
- −$1,092
- − Management
- −$1,092
- − Depreciation
- −$2,615
- Taxable loss
- −$2,207
- Est. tax savings @ 24.0%
- +$530
- After-tax cash flow
- $-366/yr
For passive investors: Depreciation is non-cash, so a rental often shows a tax loss while cash-flowing — sheltering income. Rental losses are passive: they offset passive income freely, and up to $25,000/yr can offset ordinary (W-2) income if you actively participate and your MAGI is under $100k (phasing out to $0 by $150k); unused losses carry forward. On sale, claimed depreciation is recaptured at up to 25%, and gains may owe capital-gains tax (a 1031 exchange can defer both). Figures are a year-1 estimate at your 24.0% rate — not tax advice; consult a CPA.
Schools (NCES district)
- District
- Cassville R-IV
- NCES district ID
- 2908170
- Math proficiency
- 33% ▬ 0.00%
- Reading proficiency
- 47% ▲ 1.00%
- Median HH income
- $38,738
- Composite
- 33.36/100
- National rank
- #5484
- State rank
- #157 of 324 in MO
Livability — Cassville
- Score
- 66/100
- State rank
- #243
- US rank
- #11916
Category grades
Schools grade is shown separately in the Schools card above.
Census & demographics
- Census place
- Cassville, MO
- Population (ZIP)
- 7,186
Population outlook (Barry County) Hauer SSP2
- Today (2025)
- 35,207 people
- By 2030
- 34,460 · -2.1%
- By 2040
- 32,643 · -7.3%
- By 2050
- 30,688 · -12.8%
- By 2075
- 26,898 · -23.6%
- By 2100
- 22,000 · -37.5%
Race, ethnicity, and origin ACS 2023
- Neighborhood character
- Predominantly White (90%)
- Race & ethnicity
- White 90% Hispanic / Latino 5% Two or more races 4%
- Common ancestry
- Italian 6% Lithuanian 3% Slovak 2%
- Foreign-born
- 2% · Canada, Philippines
- Languages at home
- 96% English-only · Spanish 3% German/W. Germanic 1%
Political lean MEDSL · Barry
- 2024 margin
- Solid R (+63.5) · D 17.8% · R 81.3%
- 2008→2024 swing
- -28.5pp toward R · 2008: -35.0pp · 2024: -63.5pp
- All cycles
- 2024: R+63.5 2020: R+60.8 2016: R+59.7 2012: R+44.7 2008: R+35.0
Not yet ingested
- Civics
- —
Market trends
- HPI YoY
- ▼ -16.59%
- Current HPI
- 225.8478
- Rent YoY
- —
- Metro
- —
- State GDP YoY
- ▲ 1.84%
- F500 in state
- 20
Industry mix (Fortune 500 HQ in MO)
| Industry | F500 HQs | Revenue |
|---|---|---|
| Healthcare | 1 | $163B |
|
||
| Insurance | 1 | $21B |
|
||
| Industrial Technology | 1 | $17B |
|
||
| Retail | 1 | $16B |
|
||
| Industrial Distribution | 1 | $10B |
|
||
| Utilities | 1 | $9B |
|
||
Price history
+12.5% since first listed3 events — show timeline
- 2026-03-31 Listed $89,900 SOMO
- 2022-05-13 Sold (MLS) — SOMO
- 2022-04-27 Listed $79,900 SOMO
Property tax history
+1.8%/yrLatest (2025): $456 · +7.4% YoY. Source: county tax records.
Cash-flow waterfall
monthlySold comps — $/sqft
last 12 mo · ≤1 miLoading sold comps…