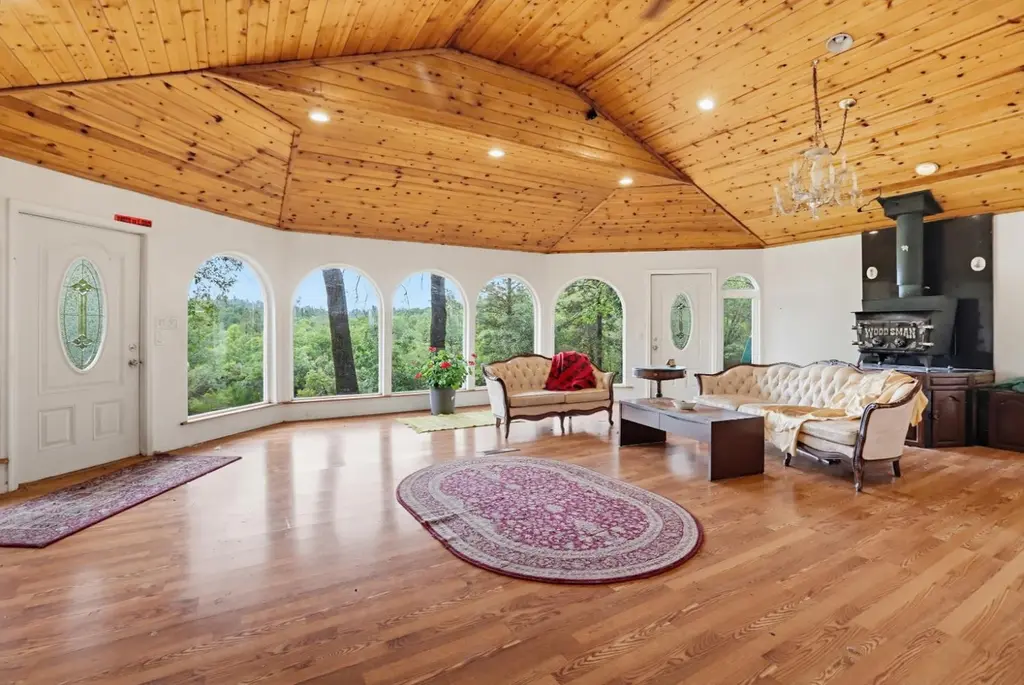
14507 Misty Winds Ln
Colfax, CA 95949
$320,000D+
3 bd · 1.5 ba ·
1,660 sqft ·
Built 1976
· SingleFamily
· Pending
· 13 DOM
Cashflow @ list (25.0% down · 7.5%)
Estimated rent
$2,556/mo
Mortgage (P&I)
−$1,678
Tax + insurance
−$349
HOA
−$0
Vac / Maint / Mgmt
−$537
Net cashflow
$-8/mo
Annual
$-91/yr
Cap rate
6.26%
Cash-on-cash
-0.10%
DSCR
1.00
1% rule
0.80%
Cash to close
$89,600
Investor read
- This is a 3-bed/1.5-bath single-family listed at $320k.
- At list price, monthly cash flow is $-8 ($-91/yr) — negative.
- To cash-flow at today's rent, offer at most $319k (0.4% below list).
- To meet the 1% rule (rent ≥ 1% of price), the offer needs to be $256k (20.1% below list).
- Only 13 days on market — expect competitive offers; lowballing is unlikely to land.
- Recommended offer: $256k (20.1% below list) — sets the bar for 1% rule.
- Local home prices are declining (-3.0%/yr); year-one equity from $2k of loan paydown is wiped out by about $10k of value loss. Plan a longer hold.
- Location reads 71/100 on livability (#216 in CA) — a middle-class / working-renter tenant base. Strengths: housing A+, health & safety A+, crime B+; Watch: amenities F, commute F, cost of living F.
- Nevada Joint Union High (town): math 25% / reading 61% proficiency, ranked #201 of 517 in CA (top 39%) — families likely to look elsewhere, expect single-tenant / working-renter base with shorter leases.
- Market conditions: 252 active listings in the ZIP; solid renter incomes; 215 units permitted in Nevada County in 2024 (0 in 5+ unit buildings).
- Nevada County population projected at -14% by 2050 — secular population decline; favor cash flow + early exit over multi-decade hold.
- Current owner paid $123k; list at $320k implies a 160% gain — meaningful room to come down on a strong offer.
- Climate carrying-cost: severe wildfire risk; extreme-heat days projected 5→12/yr by 2055 (HVAC capex compounding) — expect insurance premiums to compound above CPI over the hold.
- Cap rate 6.3% vs local median 2.5% in Colfax — top-decile yield for the area; either an underpriced asset or a hidden risk that comps aren't pricing in. Stress-test before assuming the spread holds.
- This rent runs 31% of the median local income ($98k/yr) — at the standard rent-burdened threshold; future hikes will face affordability resistance.
Questions for listing agent
- What do current leases actually rent for vs. the listed asking? Can we see a recent rent roll and the last 12 months of T-12 income?
- Built in 1976 — when were the roof, HVAC, electrical panel, plumbing, and water heater last replaced?
- Is there a deadline driving the sale (1031 exchange, divorce, estate, relocation)? That informs how much negotiation room exists.
- The area grade is low — what's the realistic commute time and amenity access for the typical tenant pool here? Any planned neighborhood developments (good or bad) we should know about?
- What's the average days-on-market for RENTAL listings here right now (not sales)? A rising rental-DOM trend means longer vacancies and softer asking-rent achievability than the comps imply.
- What's the recent tenant-quality profile in this submarket — average credit score on applications, eviction rate, late-payment / NSF rate, and stable-employment percentage? A property-management company in the area should have these aggregated.
- How much new for-sale + rental construction is in the pipeline within 1–3 miles? Heavy new supply typically softens prices + rents 12–24 months out; constrained supply supports both.
CashFlowRE · CFR-4M6XKCC3G55CFQ
· Data 3 weeks ago
cashflowre.app · 2026-05-29