14507 Misty Winds Ln · Colfax, CA
Flood risk 1/10 · Minimal
- FEMA flood zone
- X (unshaded)
- Chance of flooding over 30 yrs
- 0.0%
- Est. flood insurance / yr
- $507 – $1,088
Fire risk 9/10 · Severe
- Est. fire insurance / yr
- $659 – $1,223
Heat risk 5/10 · Moderate
- Hot days now (above 98°F)
- 5 days/yr
- Hot days in 30 yrs
- 12 days/yr
Wind risk 1/10 · Minimal
- Chance of severe wind over 30 yrs
- —
Air-quality risk 10/10 · Severe
- Unhealthy air days now
- 37 days/yr
- Unhealthy air days in 30 yrs
- 39 days/yr
Risk factors via First Street. Map © Google.
Why this score? — see what drove the D+ grade
The composite is a weighted blend of 9 inputs, each scored 0–100. Each bar is that input's sub-score; the figure is the points it added to the 100-point composite (weight × sub-score).
- ARV discount +15.0/15.0
- Cash flow +13.2/30.0
- DSCR +4.0/10.0
- Schools +3.8/10.0
- Livability +3.6/5.0
- 1% rule +3.0/10.0
- Rent growth +2.5/5.0
- Condition / age +2.5/5.0
- Appreciation +0.0/10.0
$320,000
🖨 Deal sheet 📄 Offer letter ✓ Due diligence
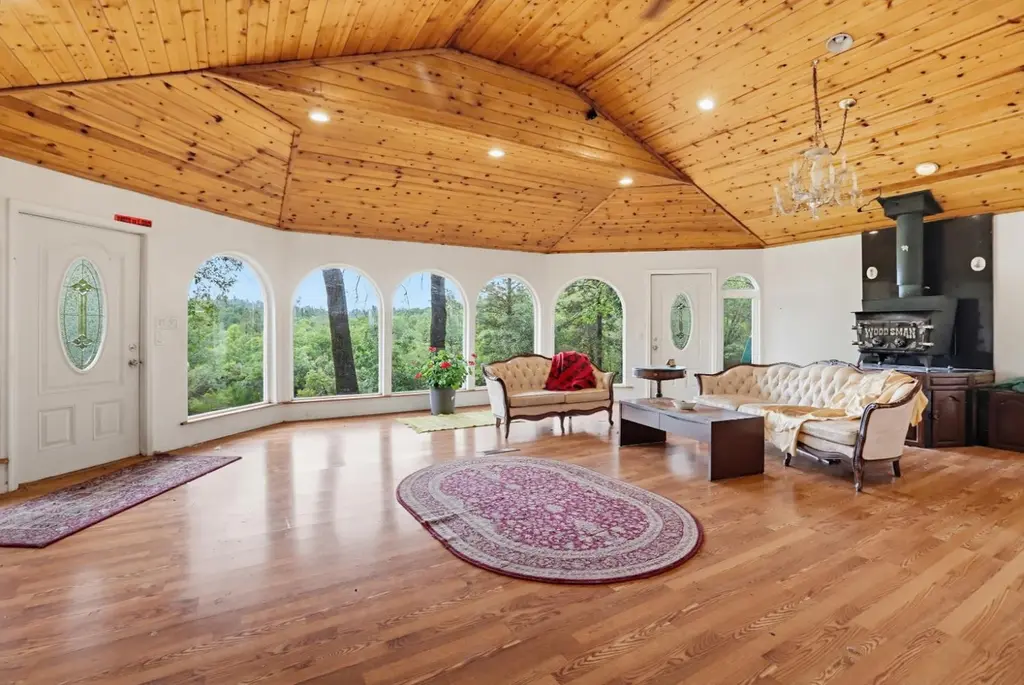
Listing remarks
No showings at this time. FIXER UPPER. This property offers space, privacy, and a convenient location with beautiful views. Featuring usable acreage with flexibility, this is the kind of land that can adapt to your vision. Adjacent BLM land enhances the open, natural feel and gives the entire setting a sense of added space and quiet that can't be built out or developed. You're close to everyday services, quality schools, and a nearby fire station for peace of mind, but what stands out most here is the potential the possibilities for how this land can be used, improved, and truly made your own. This property is rare opportunity with strong fundamentals already in place and endless room for
Key facts
- Adjacent blm land
- Usable acreage
- Beautiful views
Tags
Property features AI
Finance
- Other: Property sits on approximately 5.09 acres
- HOA & community: No homeowners association; Not a senior community
Exterior
- Parking: Gravel driveway and sidewalks
- Utilities: Propane utilities; 220-volt electric service; Well water; Septic system; Irrigation: other
- Home design: Detached single-family residence; Built in 1976; Facing and entry level not specified
- Construction: Shingle/Composition roof; Detached construction
- Exterior features: No horses allowed; Shingle/composition roof
Interior
- Kitchen: Granite countertops
- Bedrooms: 3 bedrooms (main level)
- Flooring: Carpet; Wood
- Bathrooms: 2 full bathrooms; 1 half bathroom; Tubs with shower over
- Heating & cooling: Wood stove heating; Ceiling fan(s)
- Interior features: Cathedral/vaulted living room ceiling; One-story layout
- Laundry & utility: Indoor laundry area
Neighborhood map
What this means for you Summary
Snapshot
- This is a 3-bed/1.5-bath single-family listed at $320k.
Deal economics
- At list price, monthly cash flow is $-8 ($-91/yr) — negative.
- To cash-flow at today's rent, offer at most $319k (0.4% below list).
- To meet the 1% rule (rent ≥ 1% of price), the offer needs to be $256k (20.1% below list).
- Recommended offer: $256k (20.1% below list) — sets the bar for 1% rule.
- Cap rate 6.3% vs local median 2.5% in Colfax — top-decile yield for the area; either an underpriced asset or a hidden risk that comps aren't pricing in. Stress-test before assuming the spread holds.
Location & tenants
- Location reads 71/100 on livability (#216 in CA) — a middle-class / working-renter tenant base. Strengths: housing A+, health & safety A+, crime B+; Watch: amenities F, commute F, cost of living F.
- Nevada Joint Union High (town): math 25% / reading 61% proficiency, ranked #201 of 517 in CA (top 39%) — families likely to look elsewhere, expect single-tenant / working-renter base with shorter leases.
- Market conditions: 252 active listings in the ZIP; solid renter incomes; 215 units permitted in Nevada County in 2024 (0 in 5+ unit buildings).
- This rent runs 31% of the median local income ($98k/yr) — at the standard rent-burdened threshold; future hikes will face affordability resistance.
Forward outlook
- Local home prices are declining (-3.0%/yr); year-one equity from $2k of loan paydown is wiped out by about $10k of value loss. Plan a longer hold.
- Nevada County population projected at -14% by 2050 — secular population decline; favor cash flow + early exit over multi-decade hold.
Negotiation context
- Only 13 days on market — expect competitive offers; lowballing is unlikely to land.
- Current owner paid $123k; list at $320k implies a 160% gain — meaningful room to come down on a strong offer.
Risks & watch-outs
- Climate carrying-cost: severe wildfire risk; extreme-heat days projected 5→12/yr by 2055 (HVAC capex compounding) — expect insurance premiums to compound above CPI over the hold.
Questions for the listing agent
- What do current leases actually rent for vs. the listed asking? Can we see a recent rent roll and the last 12 months of T-12 income?
- Built in 1976 — when were the roof, HVAC, electrical panel, plumbing, and water heater last replaced?
- Is there a deadline driving the sale (1031 exchange, divorce, estate, relocation)? That informs how much negotiation room exists.
- The area grade is low — what's the realistic commute time and amenity access for the typical tenant pool here? Any planned neighborhood developments (good or bad) we should know about?
- What's the average days-on-market for RENTAL listings here right now (not sales)? A rising rental-DOM trend means longer vacancies and softer asking-rent achievability than the comps imply.
- What's the recent tenant-quality profile in this submarket — average credit score on applications, eviction rate, late-payment / NSF rate, and stable-employment percentage? A property-management company in the area should have these aggregated.
- How much new for-sale + rental construction is in the pipeline within 1–3 miles? Heavy new supply typically softens prices + rents 12–24 months out; constrained supply supports both.
Investment metrics
- 1% rule
- 0.80% ✗
- Cap rate
- 6.26%
- Cash-on-cash
- -0.10%
- DSCR
- 1.00
- GRM
- 10.4
CMA / ARV
- ARV (on-the-fly)
- $481,400
- Comps found
- 2
Show comp detail 2 sales within ~0.75 mi
| Address | Dist | Beds/Ba | Sqft | Sold | Price | $/sf | Match |
|---|---|---|---|---|---|---|---|
| 22684 Dog Bar Rd | 0.56mi | 3/2.0 | 1,548 (-7%) | 7mo | $400,000 | $258 | 55 |
| 14997 Deerwood Pl | 0.55mi | 2/2.5 (-1) | 1,721 (+4%) | 10mo | $499,000 | $290 | 51 |
Match score weights: distance 35% · size 25% · config 20% · recency 20%. Top-matched comps best support the ARV.
Projected returns pro-forma
-3.0% appreciation · 3.0% rent growth · sell at horizon
- IRR
- -16.5%
- Equity multiple
- 0.42×
- Total profit
- $-52,412
- Equity at exit
- $47,713
- IRR
- -8.3%
- Equity multiple
- 0.48×
- Total profit
- $-46,565
- Equity at exit
- $27,668
Cash invested: $89,600 (down + closing). Projections, not guarantees.
Landlord ↔ Tenant lean methodology
- Overall (STATE)
- 18 Strongly Tenant-Friendly
- State California
- 18 Strongly Tenant-Friendly · D+13
- County
- — inherits STATE
- City
- — inherits STATE
ZIP-level market 95949
- Home prices YoY
- -34.7%
- Active inventory
- 252
- Price-to-rent
- 10.4×
Monthly cashflow live
- Estimated rent
- $2,556 medium interval (Pro) →
- Mortgage (P&I)
- −$1,678
- Tax from tax record
- −$216 /mo · $2,589/yr
- Insurance
- −$133
- HOA
- −$0
- Vacancy / Maint / Mgmt
- −$537
- Net cashflow
- $-8
Break-even live
UW: 25.0% down · 7.5% · 30yr · 1.5% tax · 5.0% vac · 8.0% maint · 8.0% mgmt
Financing live
Cash to close
- Down payment
- $80,000
- Closing costs
- $9,600
- Reserves months
- —
- Total cash needed
- —
Loan-product check · same deal, 3 products live
Conventional
25% down · 7.5% · 30yr
- Down + closing
- —
- Monthly P&I
- —
- Monthly cashflow
- —
- DSCR
- —
- Eligible?
- —
Personal DTI + credit; lowest rate.
DSCR
20% down · 8.5% · 30yr
- Down + closing
- —
- Monthly P&I
- —
- Monthly cashflow
- —
- DSCR
- —
- Eligible?
- —
No personal income docs; deal must DSCR.
Hard money
10% down · 12.0% · 12mo
- Down + closing
- —
- Monthly P&I
- —
- Monthly cashflow
- —
- DSCR
- —
- Eligible?
- —
Short-term bridge; refi at stabilization.
Listing history 1 events
-
1988-11-15soldstatus $123,180
ⓘ Source: listings_history table (triggers on properties + properties_extension) + one-shot
backfill from property_details.listing_events for pre-trigger history.
Tax reassessment forecast CA · Resets to sale price
- Current annual tax
- $2,589 · $216/mo
- Projected year-2 tax
- $2,589 · $216/mo
- Expected delta
- $0/yr ($0/mo · 0.0%)
ⓘ Screening estimate from a state-policy table — verify with the county assessor before closing.
Climate risk First Street
- Flood 1/10 Low FEMA zone X (unshaded) · 0% chance over 30 yrs
- Wildfire 9/10 Extreme
- Heat 5/10 Major 5 d/yr ≥98°F today · 12 d/yr by 30 yrs out
- Wind 1/10 Low
- Air quality 10/10 Extreme 37 unhealthy d/yr today · 39 by 30 yrs out
Nearby sold comps map
Loading sold comps map…
Walkable amenities ~0.75 mi
Loading nearby amenities…
Taxation est. · year 1
- Rental income
- $30,677
- − Mortgage interest
- −$17,925
- − Property taxes
- −$2,589
- − Insurance
- −$1,600
- − Repairs & maintenance
- −$2,454
- − Management
- −$2,454
- − Depreciation
- −$9,309
- Taxable loss
- −$5,654
- Est. tax savings @ 24.0%
- +$1,357
- After-tax cash flow
- $1,266/yr
For passive investors: Depreciation is non-cash, so a rental often shows a tax loss while cash-flowing — sheltering income. Rental losses are passive: they offset passive income freely, and up to $25,000/yr can offset ordinary (W-2) income if you actively participate and your MAGI is under $100k (phasing out to $0 by $150k); unused losses carry forward. On sale, claimed depreciation is recaptured at up to 25%, and gains may owe capital-gains tax (a 1031 exchange can defer both). Figures are a year-1 estimate at your 24.0% rate — not tax advice; consult a CPA.
Schools (NCES district)
- District
- Nevada Joint Union High
- NCES district ID
- 0626880
- Math proficiency
- 25% ▼ -14.00%
- Reading proficiency
- 61% ▼ -7.00%
- Median HH income
- $57,336
- Composite
- 37.53/100
- National rank
- #4393
- State rank
- #201 of 517 in CA
Livability — Colfax
- Score
- 71/100
- State rank
- #216
- US rank
- #6827
Category grades
Schools grade is shown separately in the Schools card above.
Census & demographics
- County
- Nevada County · 85,339 people
- City population
- 9,448
- Metro
- Truckee-Grass Valley, CA
- Population (ZIP)
- 20,552
- Household income
- $98,181
- Rent vs Own
- Severe rent burden
- 181.0
Population outlook (Nevada County) Hauer SSP2
- Today (2025)
- 98,490 people
- By 2030
- 97,295 · -1.2%
- By 2040
- 92,041 · -6.5%
- By 2050
- 85,164 · -13.5%
- By 2075
- 68,436 · -30.5%
- By 2100
- 49,536 · -49.7%
Race, ethnicity, and origin ACS 2023
- Neighborhood character
- Predominantly White (84%)
- Race & ethnicity
- White 84% Hispanic / Latino 8% Two or more races 8% Native American 1%
- Hispanic origin (detail)
- Mexican 6%
- Common ancestry
- Lithuanian 4% Italian 4% Slovak 2%
- Foreign-born
- 4% · Canada
- Languages at home
- 94% English-only · Spanish 3% Other Indo-European 1%
Political lean MEDSL · Nevada
- 2024 margin
- D (+12.2) · D 54.4% · R 42.1% · Other 3.5%
- 2008→2024 swing
- +6.9pp toward D · 2008: 5.3pp · 2024: 12.2pp
- All cycles
- 2024: D+12.2 2020: D+14.8 2016: D+4.5 2012: R+4.7 2008: D+5.3
Not yet ingested
- Civics
- —
Market trends
- HPI YoY
- ▼ -122.41%
- Current HPI
- 230.2373
- Rent YoY
- —
- Metro
- Truckee-Grass Valley, CA
- State GDP YoY
- ▲ 3.21%
- F500 in state
- 116
Industry mix (Fortune 500 HQ in CA)
| Industry | F500 HQs | Revenue |
|---|---|---|
| Technology | 27 | $1,492B |
|
||
| Financial Services | 3 | $174B |
|
||
| Retail | 3 | $44B |
|
||
| Insurance | 3 | $26B |
|
||
| Media / Entertainment | 2 | $115B |
|
||
| Pharmaceuticals / Biotech | 2 | $62B |
|
||
Price history
1 event — show timeline
- 1988-11-15 Sold (Public Records) $123,180 Public Records
Property tax history
+3.1%/yrLatest (2025): $2,589 · +2.0% YoY. Source: county tax records.
Cash-flow waterfall
monthlySold comps — $/sqft
last 12 mo · ≤1 miLoading sold comps…