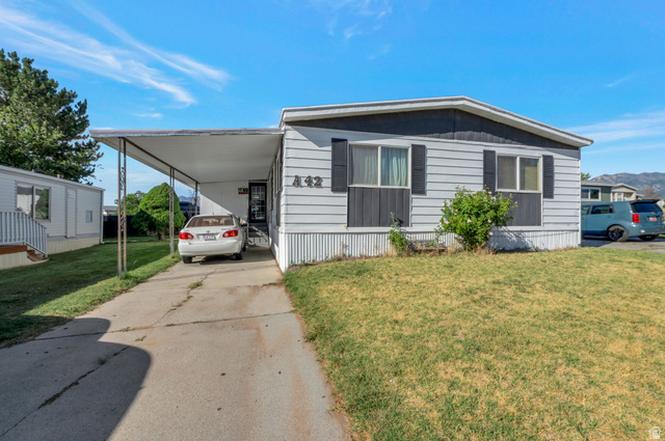
3860 S Midland Dr S Unit A42
Roy, UT 84067
$104,900C+
4 bd · 3.0 ba ·
1,600 sqft ·
Built 1978
· Manufactured
· Active
· 3 DOM
Cashflow @ list (25.0% down · 7.5%)
Estimated rent
$2,216/mo
Mortgage (P&I)
−$550
Tax + insurance
−$175
HOA
−$769
Vac / Maint / Mgmt
−$465
Net cashflow
$257/mo
Annual
$3,084/yr
Cap rate
9.23%
Cash-on-cash
10.50%
DSCR
1.47
1% rule
2.11%
Cash to close
$29,372
Investor read
- This is a 4-bed/3.0-bath manufactured listed at $105k.
- At list price, monthly cash flow is $257 ($3k/yr) — positive.
- The deal already cash-flows at list — no discount required.
- Meets the 1% rule at list price ($2k rent vs $105k).
- Only 3 days on market — expect competitive offers; lowballing is unlikely to land.
- Local home prices are declining (-3.0%/yr); year-one equity from $725 of loan paydown is wiped out by about $3k of value loss. Plan a longer hold.
- Location reads 81/100 on livability (#32 in UT, #1,449 nationally) — a professional / high-income tenant draw. Strengths: housing A+, health & safety A+, commute A; Watch: amenities F.
- Weber District (suburban): math 36% / reading 35% proficiency, ranked #56 of 80 in UT (top 70%) — families likely to look elsewhere, expect single-tenant / working-renter base with shorter leases.
- Zoned schools: North Park School (math 32% / reading 32%, grade F, #419 of 585 statewide, top 72%, 467 students, 50% FRL); Roy Jr High (math 23% / reading 25%, grade F, #123 of 138 statewide, top 90%, 1,008 students, 37% FRL); Roy High (math 15% / reading 39%, grade F, #131 of 171 statewide, top 79%, 1,834 students, 28% FRL).
- Watch-outs: HOA is 35% of rent.
- Market conditions: Rents soft (-0.5%/yr); 207 active listings in the ZIP; 19 comparable units currently listed for rent nearby; rentals at typical pace (median 16d on market — plan ~3-4 weeks tenant-placement turnaround); solid renter incomes; 1,630 units permitted in Weber County in 2024 (521 in 5+ unit buildings).
- Weber County population projected at +24% by 2050 — long-run rental-demand tailwind backs the buy-and-hold thesis.
- 3 sale attempts since 28y ago with the ask held roughly flat each time — persistent listings suggest the price (not the market) is what's stuck; bring a comps-based counter.
Questions for listing agent
- Built in 1978 — when were the roof, HVAC, electrical panel, plumbing, and water heater last replaced?
- What does the HOA fee cover, when was the last increase, and are there any pending special assessments or reserve-fund shortfalls?
- Is there a deadline driving the sale (1031 exchange, divorce, estate, relocation)? That informs how much negotiation room exists.
- Schools are D-rated, which usually means shorter tenancies and higher turnover. Who's the typical renter profile here, and what's been the actual vacancy rate?
- What's the average days-on-market for RENTAL listings here right now (not sales)? A rising rental-DOM trend means longer vacancies and softer asking-rent achievability than the comps imply.
- What's the recent tenant-quality profile in this submarket — average credit score on applications, eviction rate, late-payment / NSF rate, and stable-employment percentage? A property-management company in the area should have these aggregated.
- How much new for-sale + rental construction is in the pipeline within 1–3 miles? Heavy new supply typically softens prices + rents 12–24 months out; constrained supply supports both.
CashFlowRE · CFR-4PA2X44QCAZ7QA
· Data 52 min ago
cashflowre.app · 2026-05-29